



Bitcoin has fallen about 14% in seven days to around $63,500 on Nov. 18, after a weekend sell-off briefly took it close to $62,000.
Summary
- Bitcoin erased more than $10,000 from its Nov. 11 level near $74,000.
- U.S. spot Bitcoin ETFs logged $239.9 million in net outflows on Tuesday after a small Monday inflow.
- Crypto liquidations topped $2 billion over 24 hours during the weekend sell-off, according to KuCoin.
- The daily and weekly charts put the next test for Bitcoin in the $62,000–$62,500 area.
TradingView’s Binance BTC/USDT chart showed Bitcoin near $63,510 on Wednesday afternoon UTC, down about 2.2% on the day. Bitcoin slipped through $70,000 on Nov. 13 and fell close to $62,000 on Sunday before recovering part of the drop. By Wednesday, it was back below $64,000, leaving it more than $10,000 below where it traded a week earlier. Sunday’s sell-off had already taken Bitcoin to a three-month low.
Bitcoin ETF outflows resume as tech stocks face a volatile week
U.S. spot Bitcoin ETFs lost about $1.91 billion over seven consecutive trading sessions through Nov. 13, according to SoSoValue figures reported Saturday. The funds took in a net $7.9 million on Monday, then gave back that gain and more on Tuesday. BlackRock’s IBIT accounted for $209.5 million of Tuesday’s $239.9 million in net outflows, or about 87%.
The timing matters because the steepest leg of the sell-off came over the weekend, when U.S. ETFs were closed. Bitcoin continued to trade around the clock, falling roughly another $8,000 from the $70,000 threshold to Sunday’s low. Monday’s small inflow was the first chance to see whether U.S. fund buyers would step in after that drop. Tuesday’s redemptions more than erased it, leaving the two sessions with a combined $232 million in net withdrawals.
The selling came after U.S. consumer prices rose 0.4% in October from the prior month, while prices excluding food and energy rose 0.3%. Persistent inflation gives the Federal Reserve less room to ease monetary policy. For Bitcoin, higher rates also mean investors can earn more on cash and short-term government debt while waiting out a volatile market.
The week’s losses also coincided with a shake-up in AI stocks. Nvidia announced on Nov. 12 that co-founder Jensen Huang had resigned as chief executive and that Chief Financial Officer Colette Kress would serve as interim CEO.
Attention then shifted to Anthropic’s expected Thursday Nasdaq debut. Karl Cheong, head of ETFs at Ninepoint Partners, told Reuters that he saw the crypto sell-off as a sign that some retail investors were raising cash for the offering. Nasdaq certified Anthropic’s Class A shares for listing on Wednesday.
Bitcoin price trades just above its lower Bollinger Band
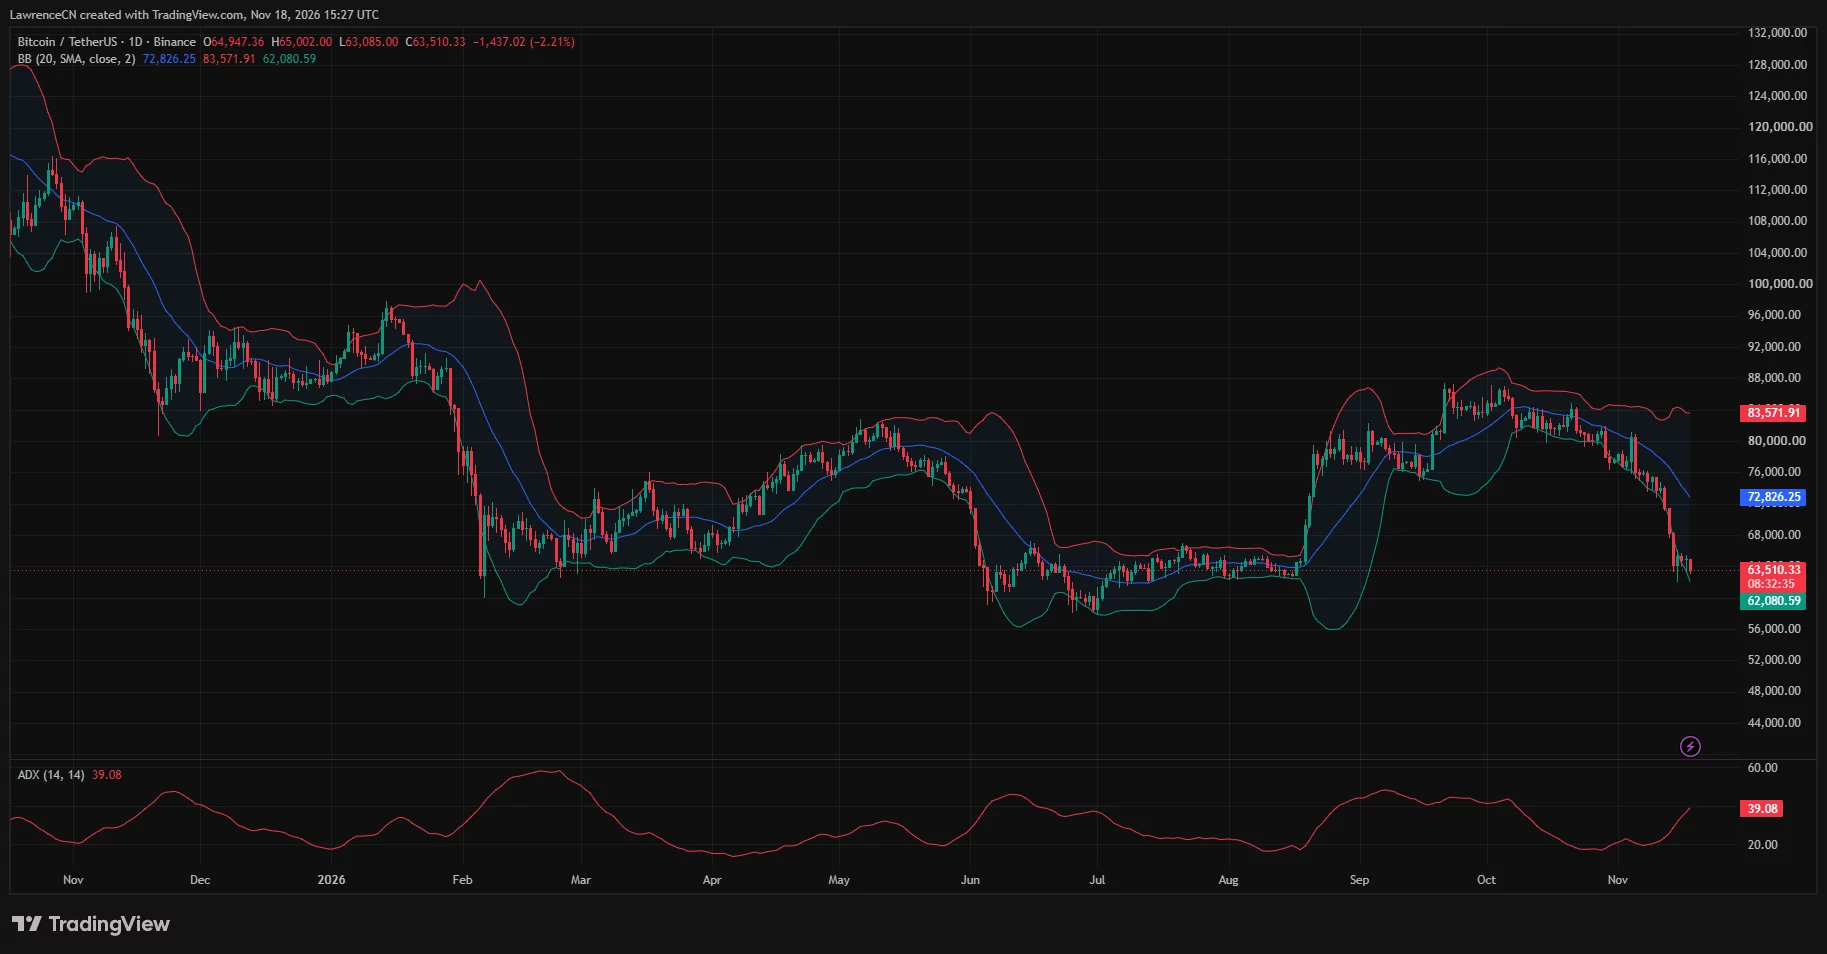
On the daily chart, Bitcoin was about $1,430 above the lower Bollinger Band at $62,081 and well below the 20-day moving average at $72,826. The Average Directional Index rose to 39.08 as prices fell, a sign the prevailing trend had gained strength. ADX measures the strength of a trend, while the recent price action shows its direction.
On the weekly chart, Bitcoin was trading just above the $62,500 Murrey Math level. That puts a weekly reference point within roughly $420 of the daily lower band. Weekly Chaikin Money Flow was still slightly positive at 0.02, a reading close to neutral after the recent pullback.
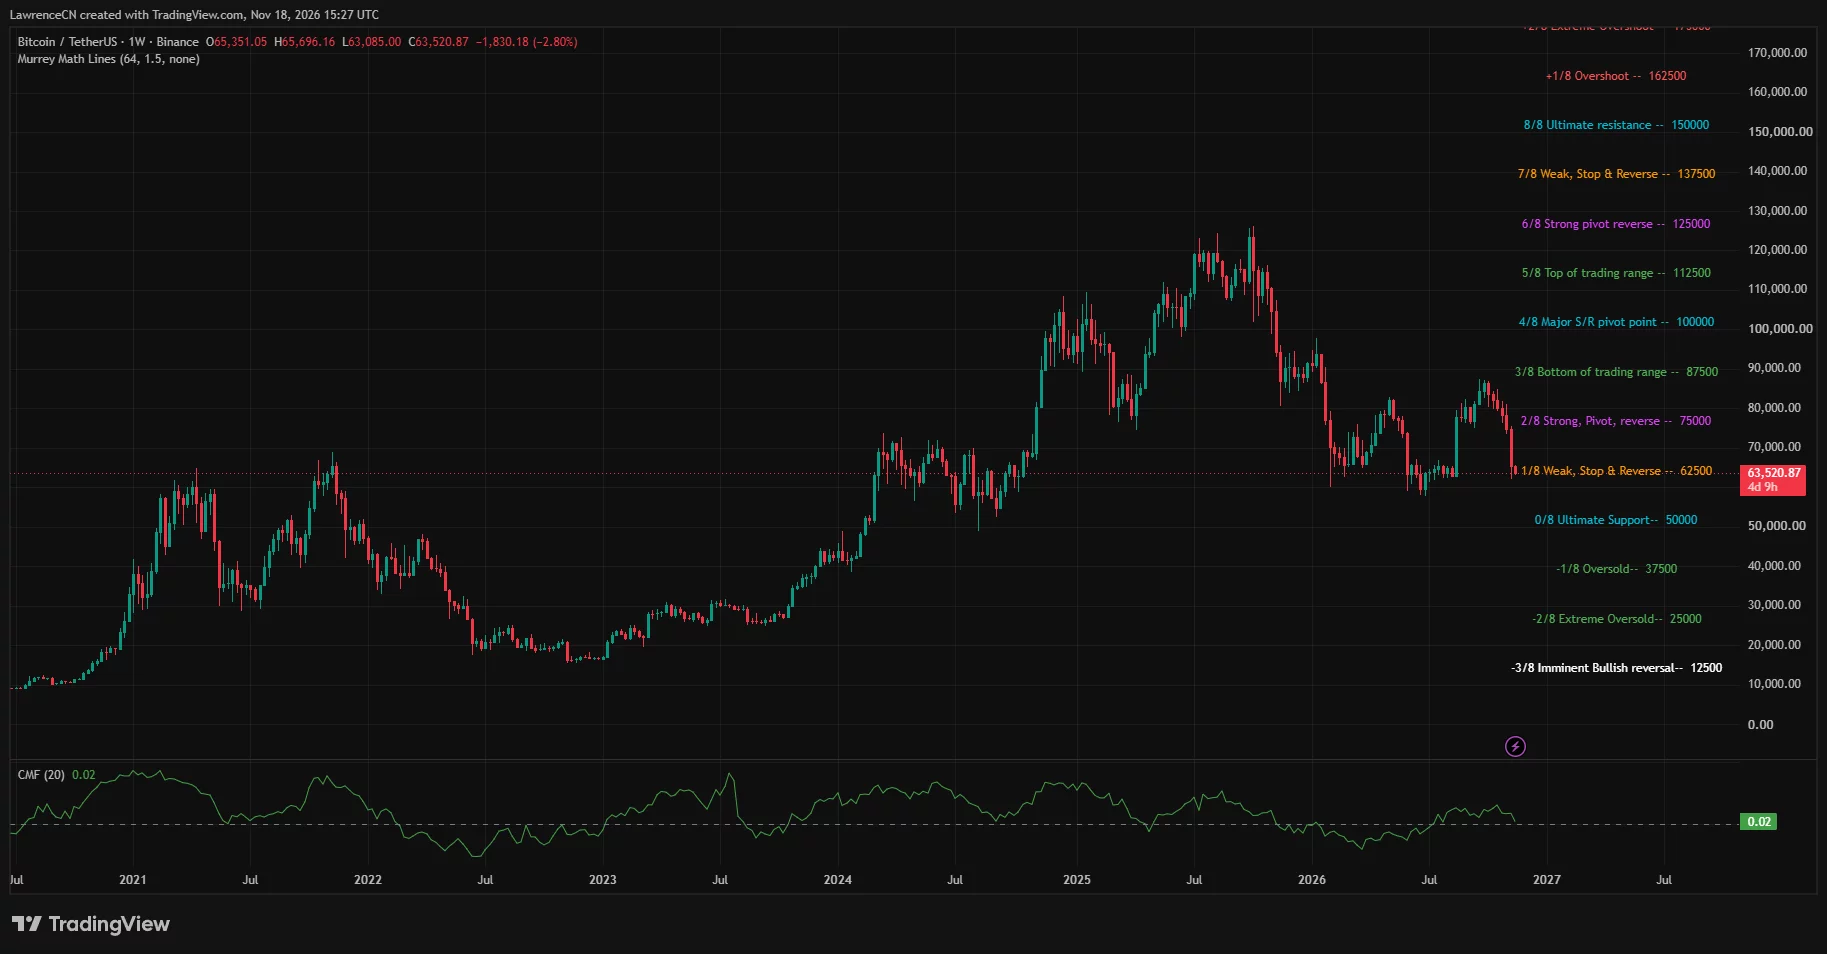
The first hurdle for a rebound is much closer than the 20-day average. Even a move back through $65,000 would leave Bitcoin below the weekly candle’s high near $65,700 and well short of the $70,000 level it lost on Friday.
Trader Altcoin Sherpa described the short-term market as choppy and said Bitcoin could bounce somewhere between its Wednesday trading level and $62,000. His chart showed how several attempts to move higher since Sunday’s low had run into selling around the mid-$65,000s.
Bitcoin liquidation heatmap shows clusters near $63K and $66K
KuCoin put total crypto liquidations at more than $2 billion over 24 hours during the weekend sell-off. Forced closures of leveraged longs can add to selling as prices fall. The same mechanism can work in reverse if a rebound forces traders to buy back short positions.
CoinGlass’s seven-day liquidation heatmap showed Bitcoin at $63,529, with a nearby cluster of potential liquidations around $63,000. Above the market, another cluster sat near $64,700, followed by brighter bands between roughly $66,000 and $66,700. Those bands show where leveraged positions could be forced to close if Bitcoin reaches those prices.
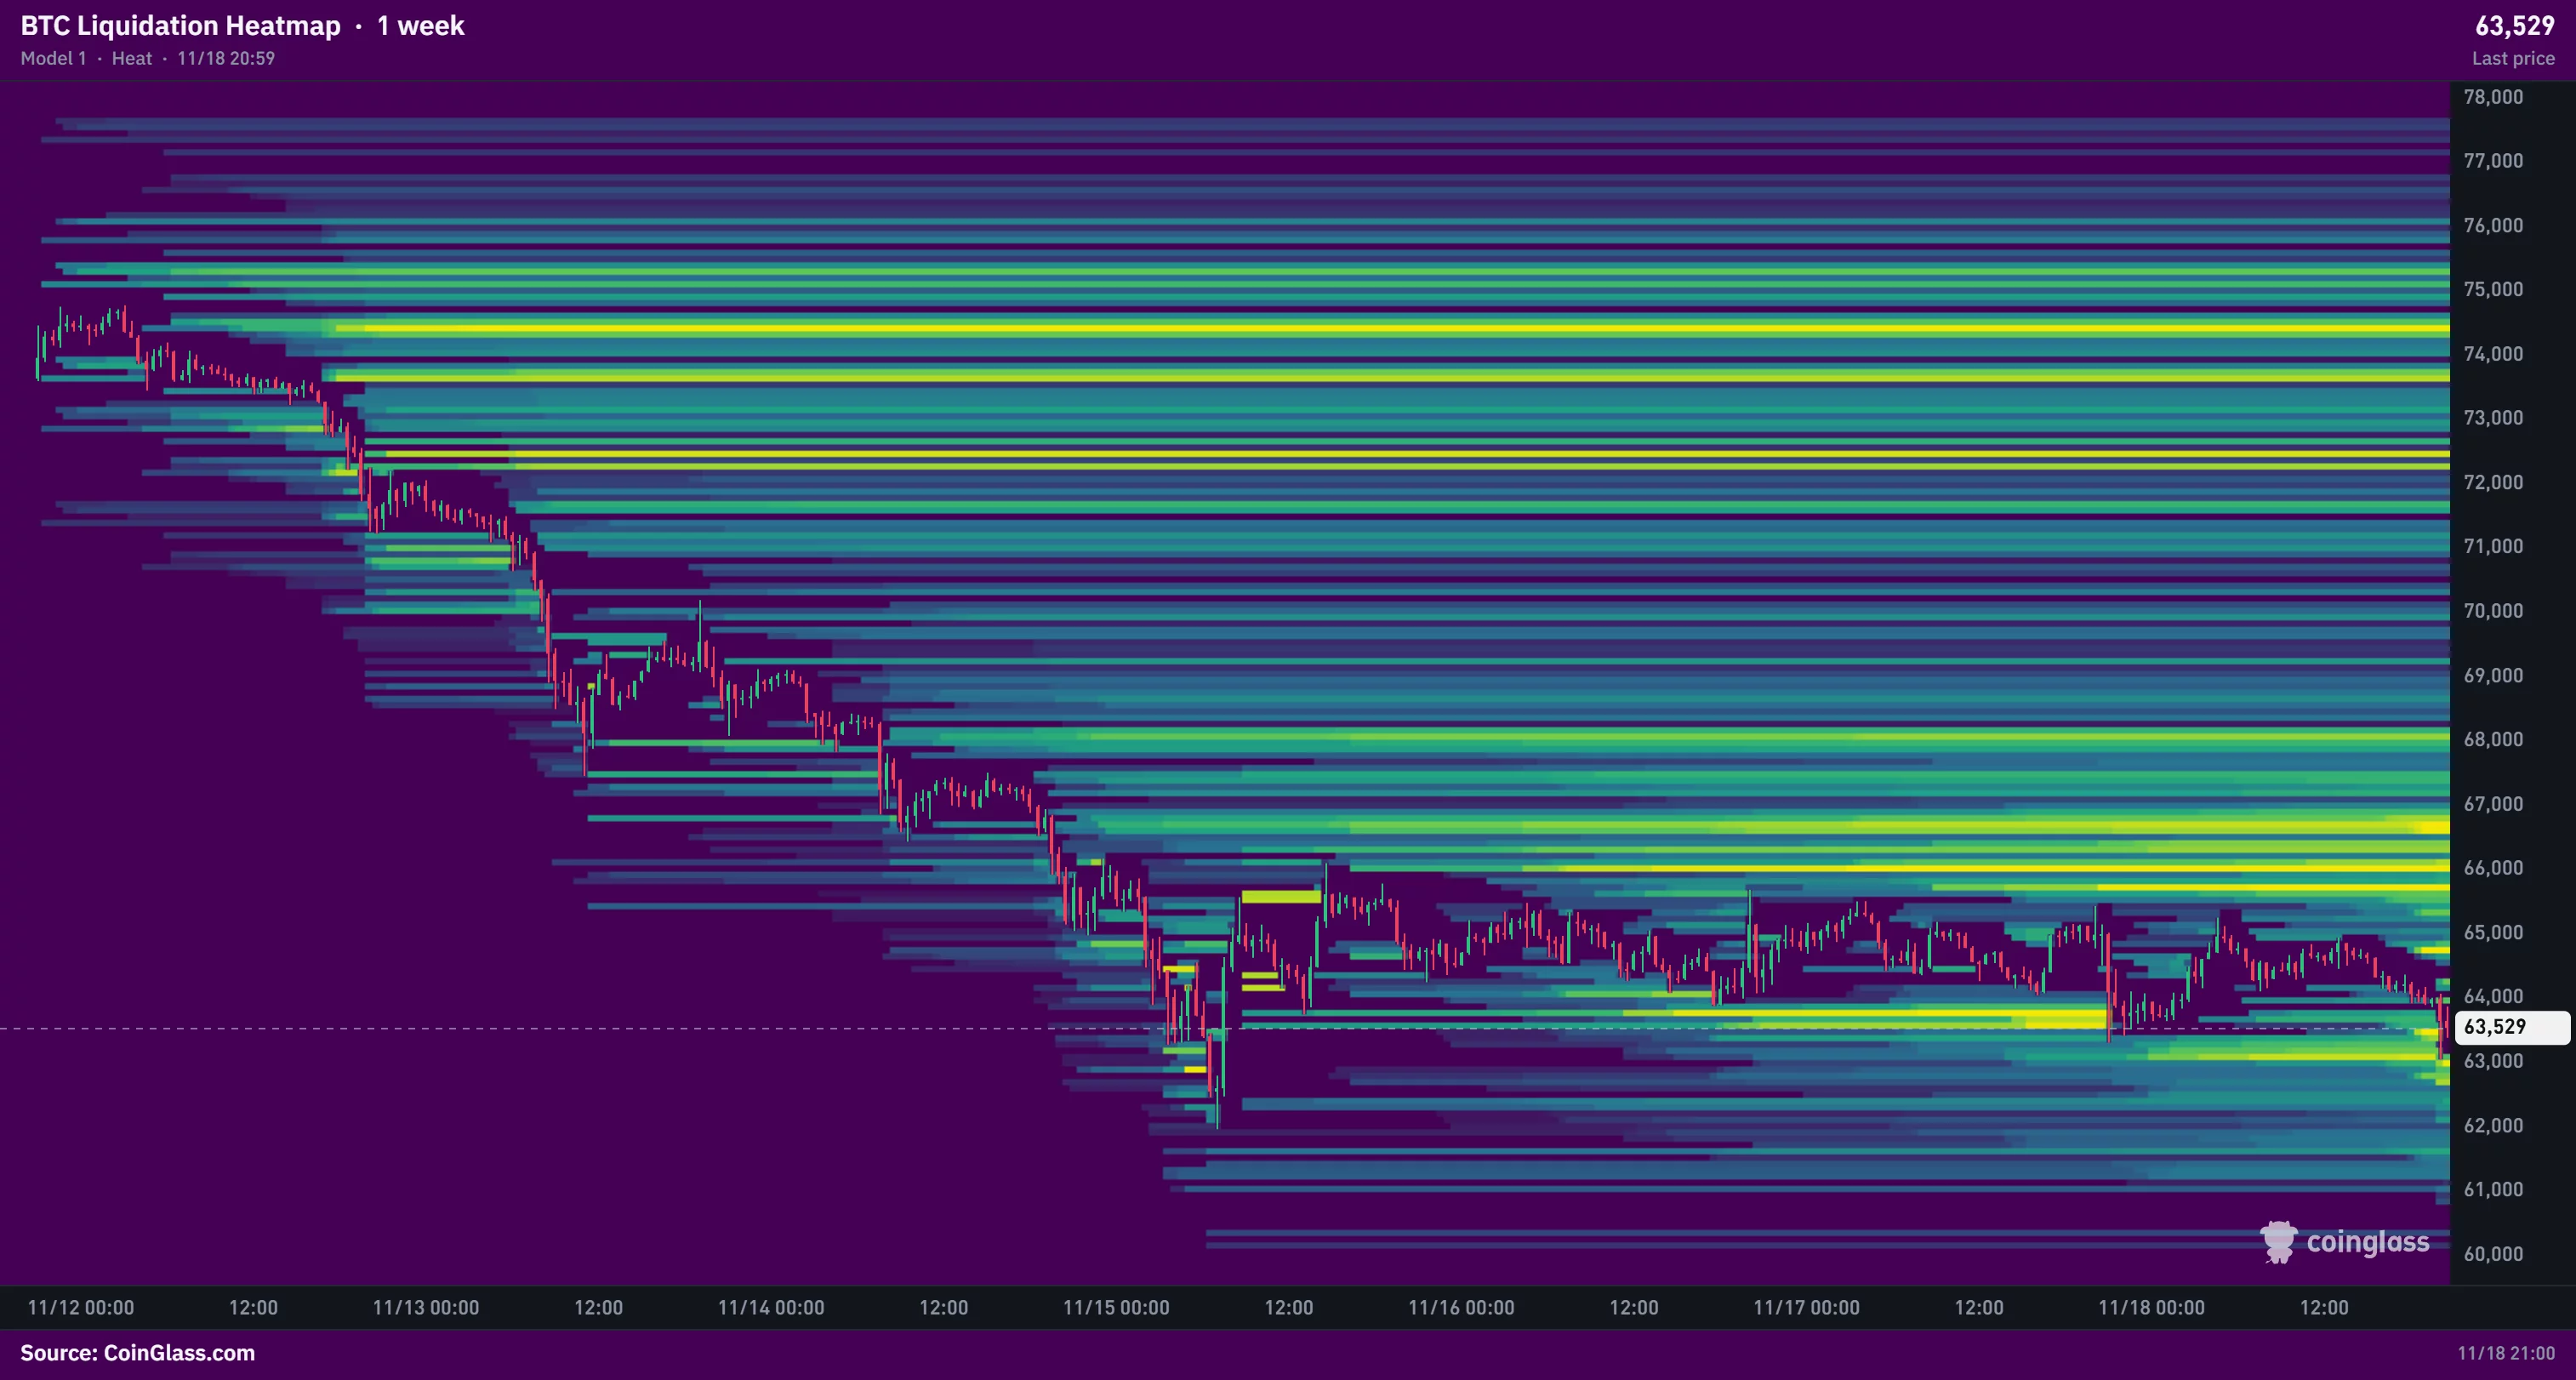
Market commentator Ted Pillows pointed to rising futures open interest during Wednesday’s price drop and suggested some traders were adding shorts. Open interest counts outstanding contracts, so the rise shows that positioning grew as Bitcoin fell. At the time of the heatmap snapshot, Bitcoin was about $530 above the nearest downside cluster at $63,000.
Disclosure: This article does not represent investment advice. The content and materials featured on this page are for educational purposes only.
