



Bitcoin price has recovered to around $81,731 after falling below $80,000 this week, while a daily retreat beneath its Bollinger midpoint has left traders divided over whether the rebound can reach $84,000.
Summary
- Bitcoin traded near $81,731, down 2.44% from its weekly opening price on Binance.
- Daily Bollinger Bands placed the midpoint at $83,478 and the lower boundary near $80,592.
- Weekly RSI stood at 56.75, while the green Supertrend line remained near $66,812.
- Market commentator Wealthmanager outlined a conditional $90,000 target if Bitcoin breaks above $84,000.
TradingView’s Binance BTC/USDT charts at 8:11 a.m. UTC on Oct. 17 showed Bitcoin trading above its weekly low of $79,800 but below the week’s $83,773 opening price. The weekly high stood at $84,352, leaving the market inside a range it had already crossed in both directions.
The daily snapshot recorded a 0.14% gain, with price moving between $81,416 and $81,770. Against the weekly decline, that modest daily advance showed a rebound that had yet to recover the ground lost earlier in the week.
Bitcoin price remains below its $83,478 daily midpoint
On TradingView’s daily chart, Bitcoin sat below the 20-day simple moving average used as the Bollinger Bands’ midpoint. The indicator placed that average at $83,477.61, with the upper band at $86,362.74 and the lower band at $80,592.47.
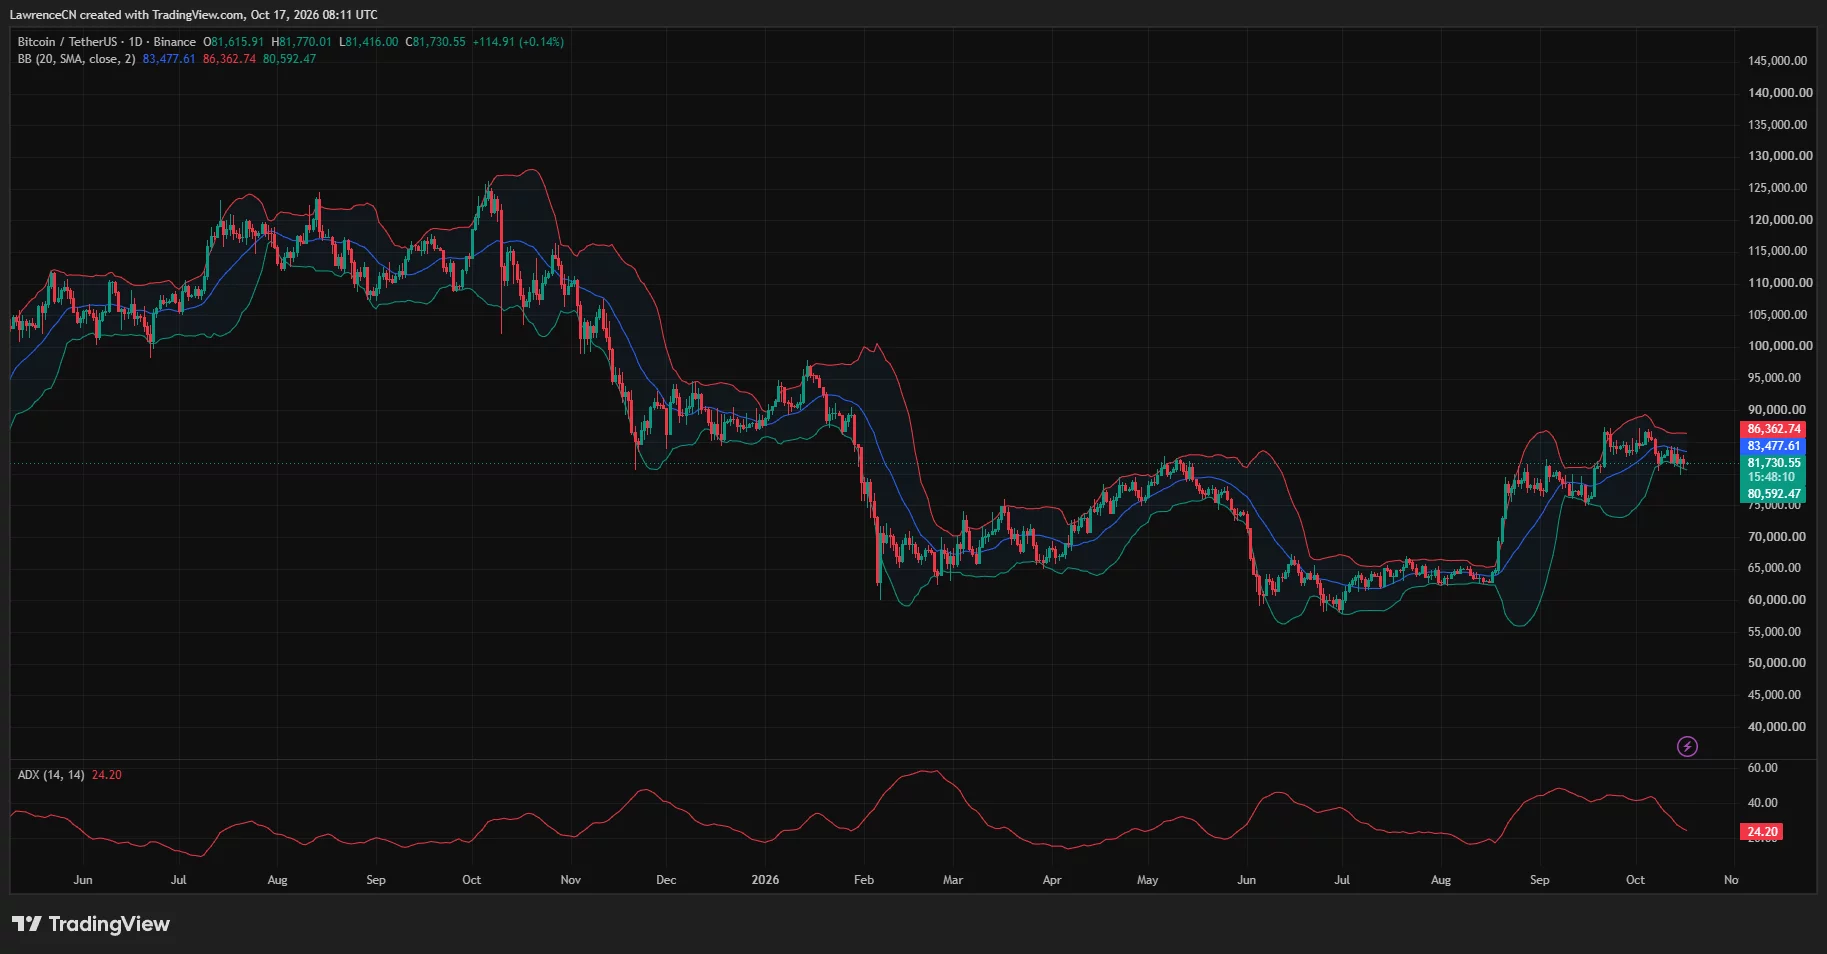
Calculated from those readings, Bitcoin was roughly 2.1% below the midpoint and 1.4% above the lower band. The chart therefore placed the latest price closer to the lower boundary than to its central average.
After approaching the upper-$80,000 region in late September and early October, Bitcoin repeatedly retreated on the daily chart. TradingView’s Oct. 17 reading placed the price below both that region and the Bollinger midpoint.
TradingView’s daily average directional index, or ADX, read 24.20 after declining from its earlier October readings. ADX measures trend strength without establishing whether the direction is bullish or bearish; the price chart supplied the downward direction of the latest move.
Earlier, crypto.news reported the loss of $82,000 on Oct. 14, when Bitcoin retreated from a session high above $84,100. Trader Lennart Snyder linked that decline to the U.S. inflation release and identified $80,300 as one of his downside targets.
Analysts disagree over the rebound from $80,000
Market commentator Wealthmanager took a conditional bullish view in an Oct. 17 post, pointing to Bitcoin’s bounce from $80,000 and a descending channel drawn across its recent price action.
“If we get a break above $84K, $90K could be the next target.”
The commentator identified $80,000 as the level he wanted Bitcoin to hold. His accompanying chart drew a possible move through the channel’s upper boundary, with the projected rise dependent on a breakout.
From the TradingView reference price of $81,730.55, reaching $84,000 would require a gain of approximately 2.8%. A move to $90,000 would amount to roughly 10.1%, calculated from the same starting price.
Crypto analyst Jesse Olson offered a more cautious assessment in an Oct. 16 post.
“BTC remains bearish on the daily chart.”
Olson said the session was heading toward the correction’s lowest daily closing price. His statement described the market at the time of his post; the Oct. 17 TradingView snapshot subsequently showed Bitcoin trading near $81,731.
A separate Oct. 16 assessment identified a bearish structure, with trader Ardi requiring a break above $84,200 before considering long positions toward the top of the range. His threshold sat $200 above Wealthmanager’s stated breakout level.
Weekly RSI holds above 50 despite the price decline
TradingView’s weekly chart recorded RSI at 56.75, above the neutral 50 level and its displayed average of 51.82. The weekly momentum reading remained above that midpoint even as Bitcoin traded 2.44% below its weekly opening price.
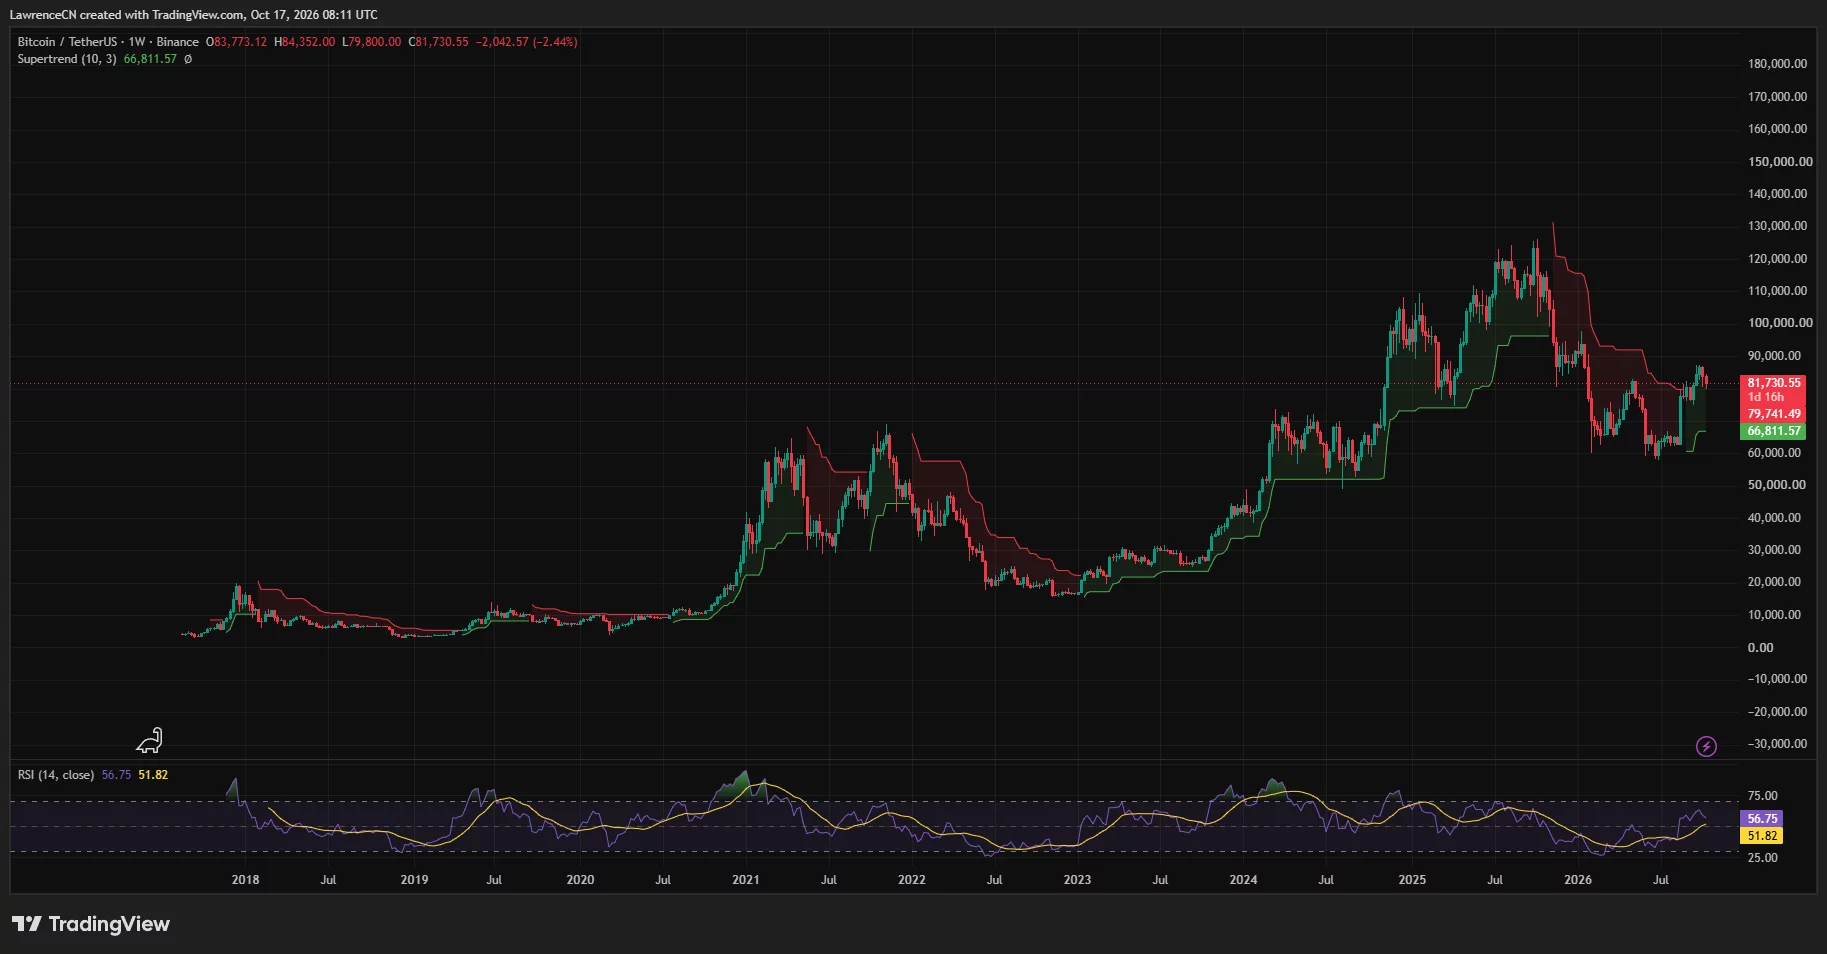
The same chart displayed a green Supertrend line at $66,811.57. Bitcoin stood approximately 22.3% above that indicator, calculated using the displayed price and line value.
At $66,811.57, the weekly Supertrend line sat nearly $13,000 below the recent $79,800 low. TradingView’s daily lower Bollinger Band was much closer to price, roughly $792 above that weekly low.
Bitfinex analysts had outlined downside conditions on Oct. 6, identifying sustained trading below $81,300 alongside ETF withdrawals as circumstances that could bring $77,000 and the $77,200 True Market Mean back into view. Their assessment was conditional on both price and fund flows.
Liquidation concentrations sit around $84,500
CoinGlass’s one-week heatmap showed its brightest overhead bands around $84,400–$84,800. Smaller concentrations appeared around $83,200–$83,700, while lower bands were visible around $80,000–$80,800 and beneath $80,000.
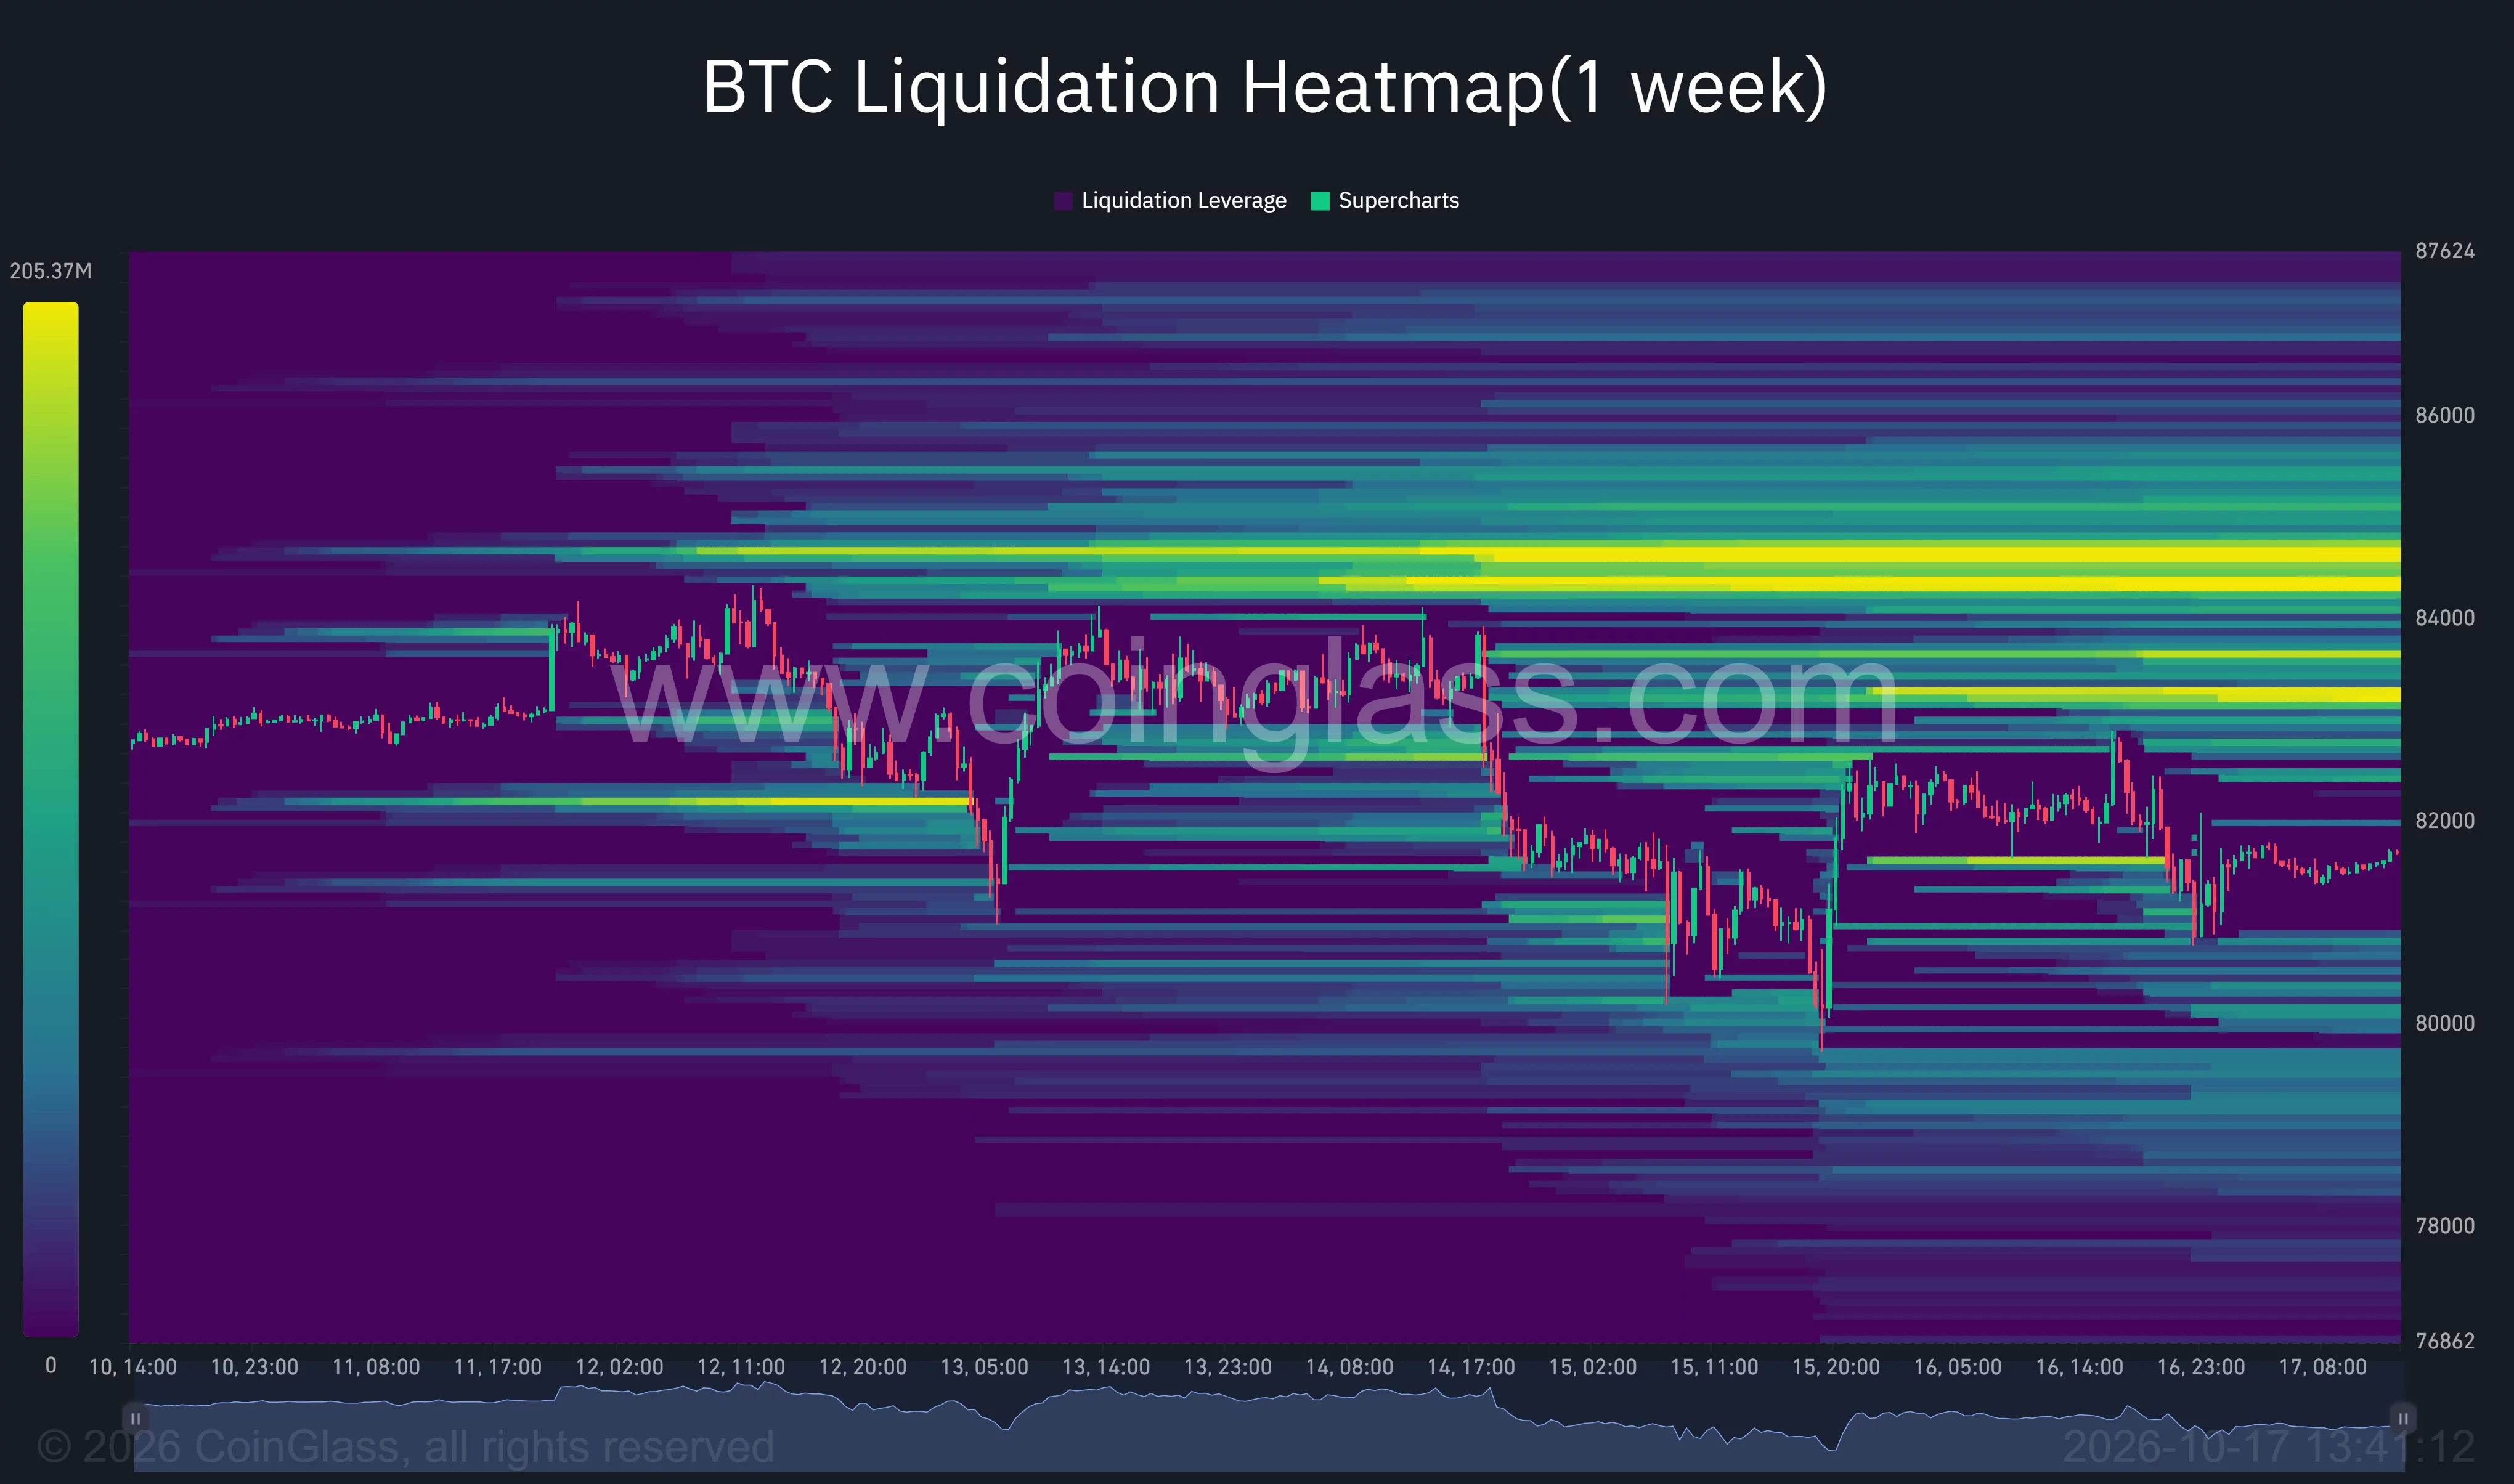
The heatmap plotted estimated liquidation concentrations, not completed liquidations. Its price trace showed repeated rebounds and declines during the week, including a move below $80,000 before the latest recovery.
U.S. inflation releases formed the backdrop to that trading. The Bureau of Labor Statistics recorded September consumer inflation at 3.7% annually and 0.6% monthly in its Oct. 14 release.
The following day’s producer inflation release put annual wholesale inflation at 6.3%. In the original release, BLS recorded a 1.3% monthly rise in final-demand prices, comprising a 2.6% rise in goods prices and a 0.8% rise in services prices.
Disclosure: This article does not represent investment advice. The content and materials featured on this page are for educational purposes only.
