



Bitcoin price fell below $64,000 on Aug. 11 as rising oil prices and uncertainty before the U.S. inflation report weakened risk appetite, leaving traders focused on whether the $63,900 support level can prevent a deeper correction.
Summary
- Bitcoin price fell about 2% to $63,780 before recovering above $64,000 during the session.
- The $63,900–$64,000 region is the main short-term pivot ahead of the July CPI report.
- Daily RSI remains neutral at 50.31, while BTC trades below its 100-day and 200-day moving averages.
- Liquidation clusters near $63,700 and $65,600 could attract price during the next volatility spike.
Bitcoin price drops below $64,000
According to data from crypto.news, Bitcoin (BTC) price traded as low as $63,852 on Binance before recovering to approximately $64,281 at the time the daily chart was captured. The intraday rebound reduced the loss, but BTC remained below the $65,000 level that buyers had attempted to establish as support over the previous four days.
The decline followed another deterioration in U.S.-Iran negotiations over reopening the Strait of Hormuz. Brent crude rose above $89 a barrel as reduced hopes for an agreement renewed concerns about energy supplies and inflation.
Higher oil prices can complicate the Federal Reserve’s inflation outlook by raising transportation and production costs. That pressure reduced demand for risk assets as U.S. traders prepared for the July Consumer Price Index report.
Broader crypto markets also weakened during the move. Ether and XRP fell more than 2%, while Bitcoin lost the $64,000 level after failing to hold above $65,000.
SoSoValue data shows that institutional demand offered limited support. U.S. spot Bitcoin exchange-traded funds recorded $144.6 million in net outflows on Aug. 10, ending five consecutive sessions of positive flows. The reversal reduced one source of spot demand as macroeconomic uncertainty increased.
Daily chart shows Bitcoin trapped in consolidation
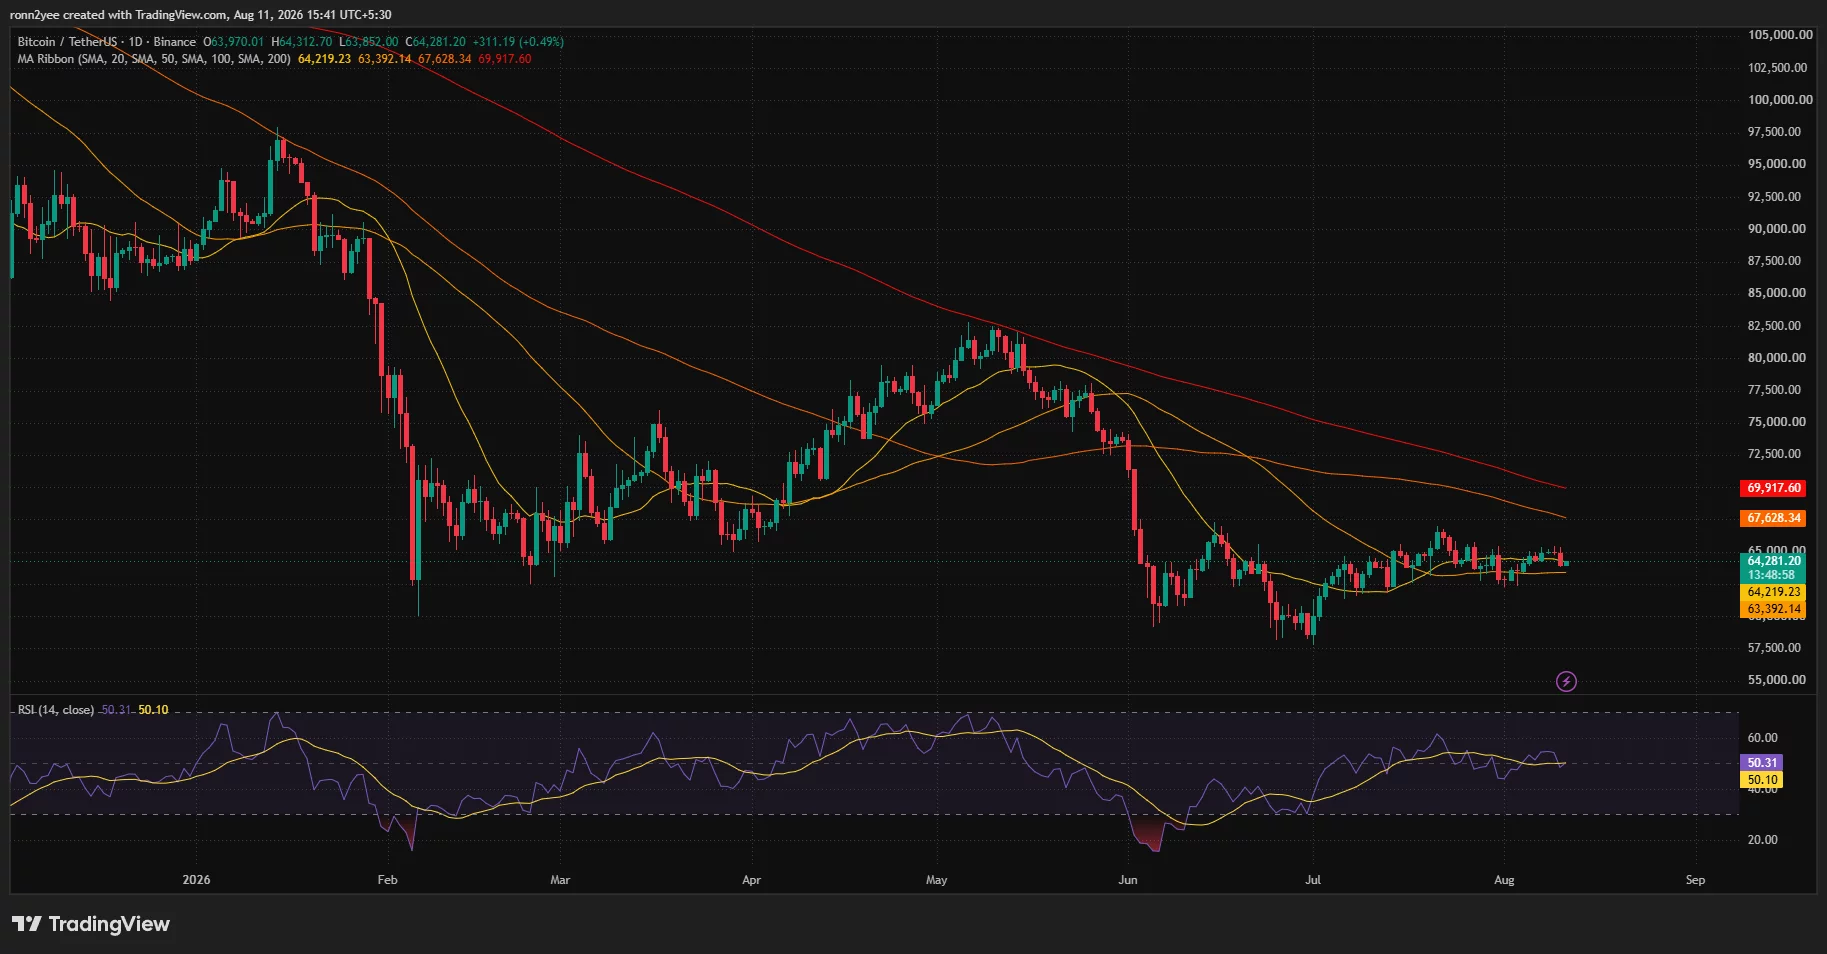
The daily chart shows that Bitcoin’s price remains locked inside the broad range formed after the June decline. BTC has repeatedly found buyers near $60,000–$63,000, but attempts to establish a sustained recovery above $65,000 have failed.
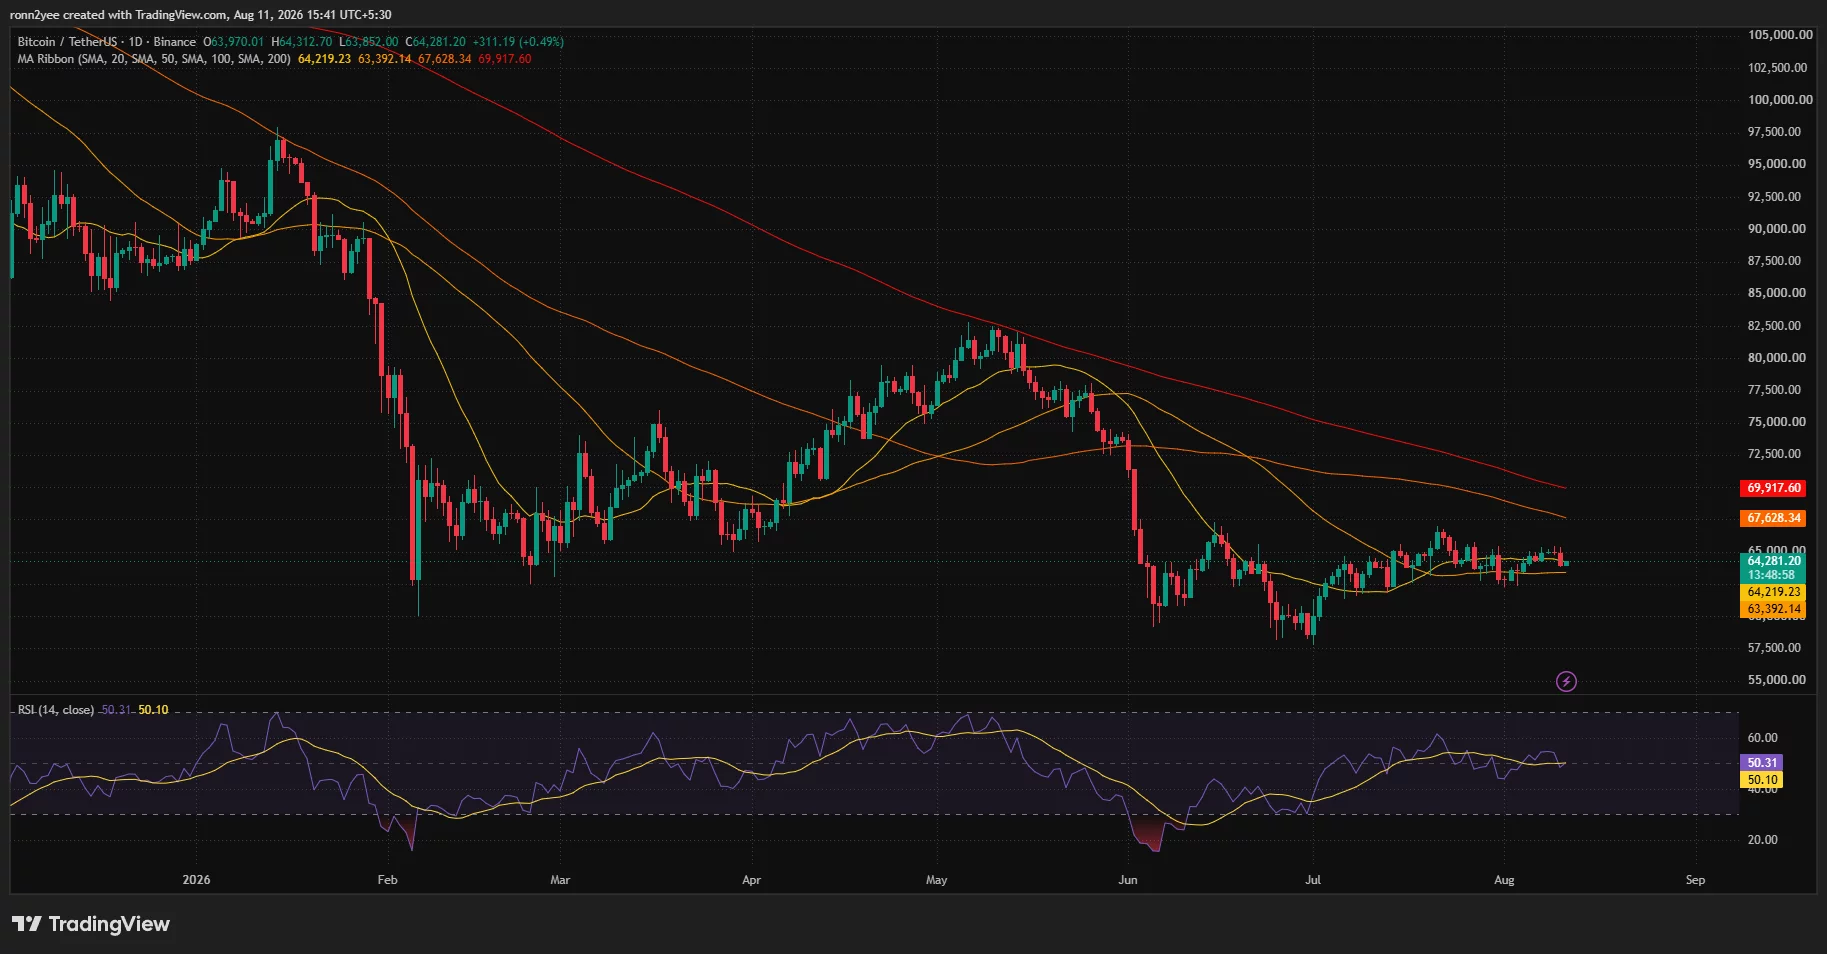
The asset was trading slightly above its 20-day simple moving average at $64,219 and its 50-day SMA at $63,392. Holding both averages would keep the short-term recovery structure intact despite the latest sell-off.
However, the wider trend remains under pressure. Bitcoin continues to trade below the 100-day SMA at $67,628 and the 200-day SMA at $69,918. Those averages are also sloping downward, creating a large resistance area between approximately $67,600 and $70,000.
The daily relative strength index stood at 50.31, almost level with its signal line at 50.10. The reading shows that neither buyers nor sellers have decisive momentum. It also supports the view that Bitcoin remains in consolidation instead of entering a confirmed directional trend.
A daily close below the 50-day SMA at $63,392 would weaken the recovery and expose $62,000, followed by the June-July demand zone between $57,500 and $60,000. Conversely, a close above $65,500 would give buyers another opportunity to challenge the 100-day SMA.
$63,900 is the key Bitcoin support
The 4-hour chart places immediate support between $63,900 and $64,000. Bitcoin briefly moved that region below during the sell-off before recovering, indicating that buyers were still active around the weekly midpoint.
Trader Lennaert Snyder described $63,900 as an important level because it represents the 50% mark of the previous weekly candle. He said holding or losing that price could determine momentum for the remainder of the week.
Under the bullish scenario, continued support near $63,900 could produce another move toward the previous weekly high around $65,500. That level rejected Bitcoin during its latest advance and remains the first major barrier above the current range.
A bearish break would become more convincing if BTC loses $63,900 and falls below the recent $63,200 low. Such a move could send BTC price toward $62,000 and allow sellers to target the lower part of the wider consolidation range.
The 4-hour Supertrend has turned bearish, placing resistance at $65,210. Bitcoin also slipped below the indicator’s former support near $64,344 during the decline. Bulls must reclaim both levels before the short-term trend can return to a stronger position.
Bull-bear power stood at negative 612, confirming that sellers had regained short-term control. However, the negative reading was smaller than the extreme levels recorded during earlier June sell-offs, suggesting that bearish momentum had not yet reached capitulation conditions.
Trader Daan Crypto Trades similarly identified $64,000 as the main pivot. He noted that BTC had closed slightly below the 4-hour 200-period moving averages but had started to stabilize, with several large-cap altcoins still showing relative strength.
Liquidation heatmap points to $63,700 and $65,600
The one-week CoinGlass liquidation heatmap shows large concentrations of leveraged positions on both sides of Bitcoin’s current price.
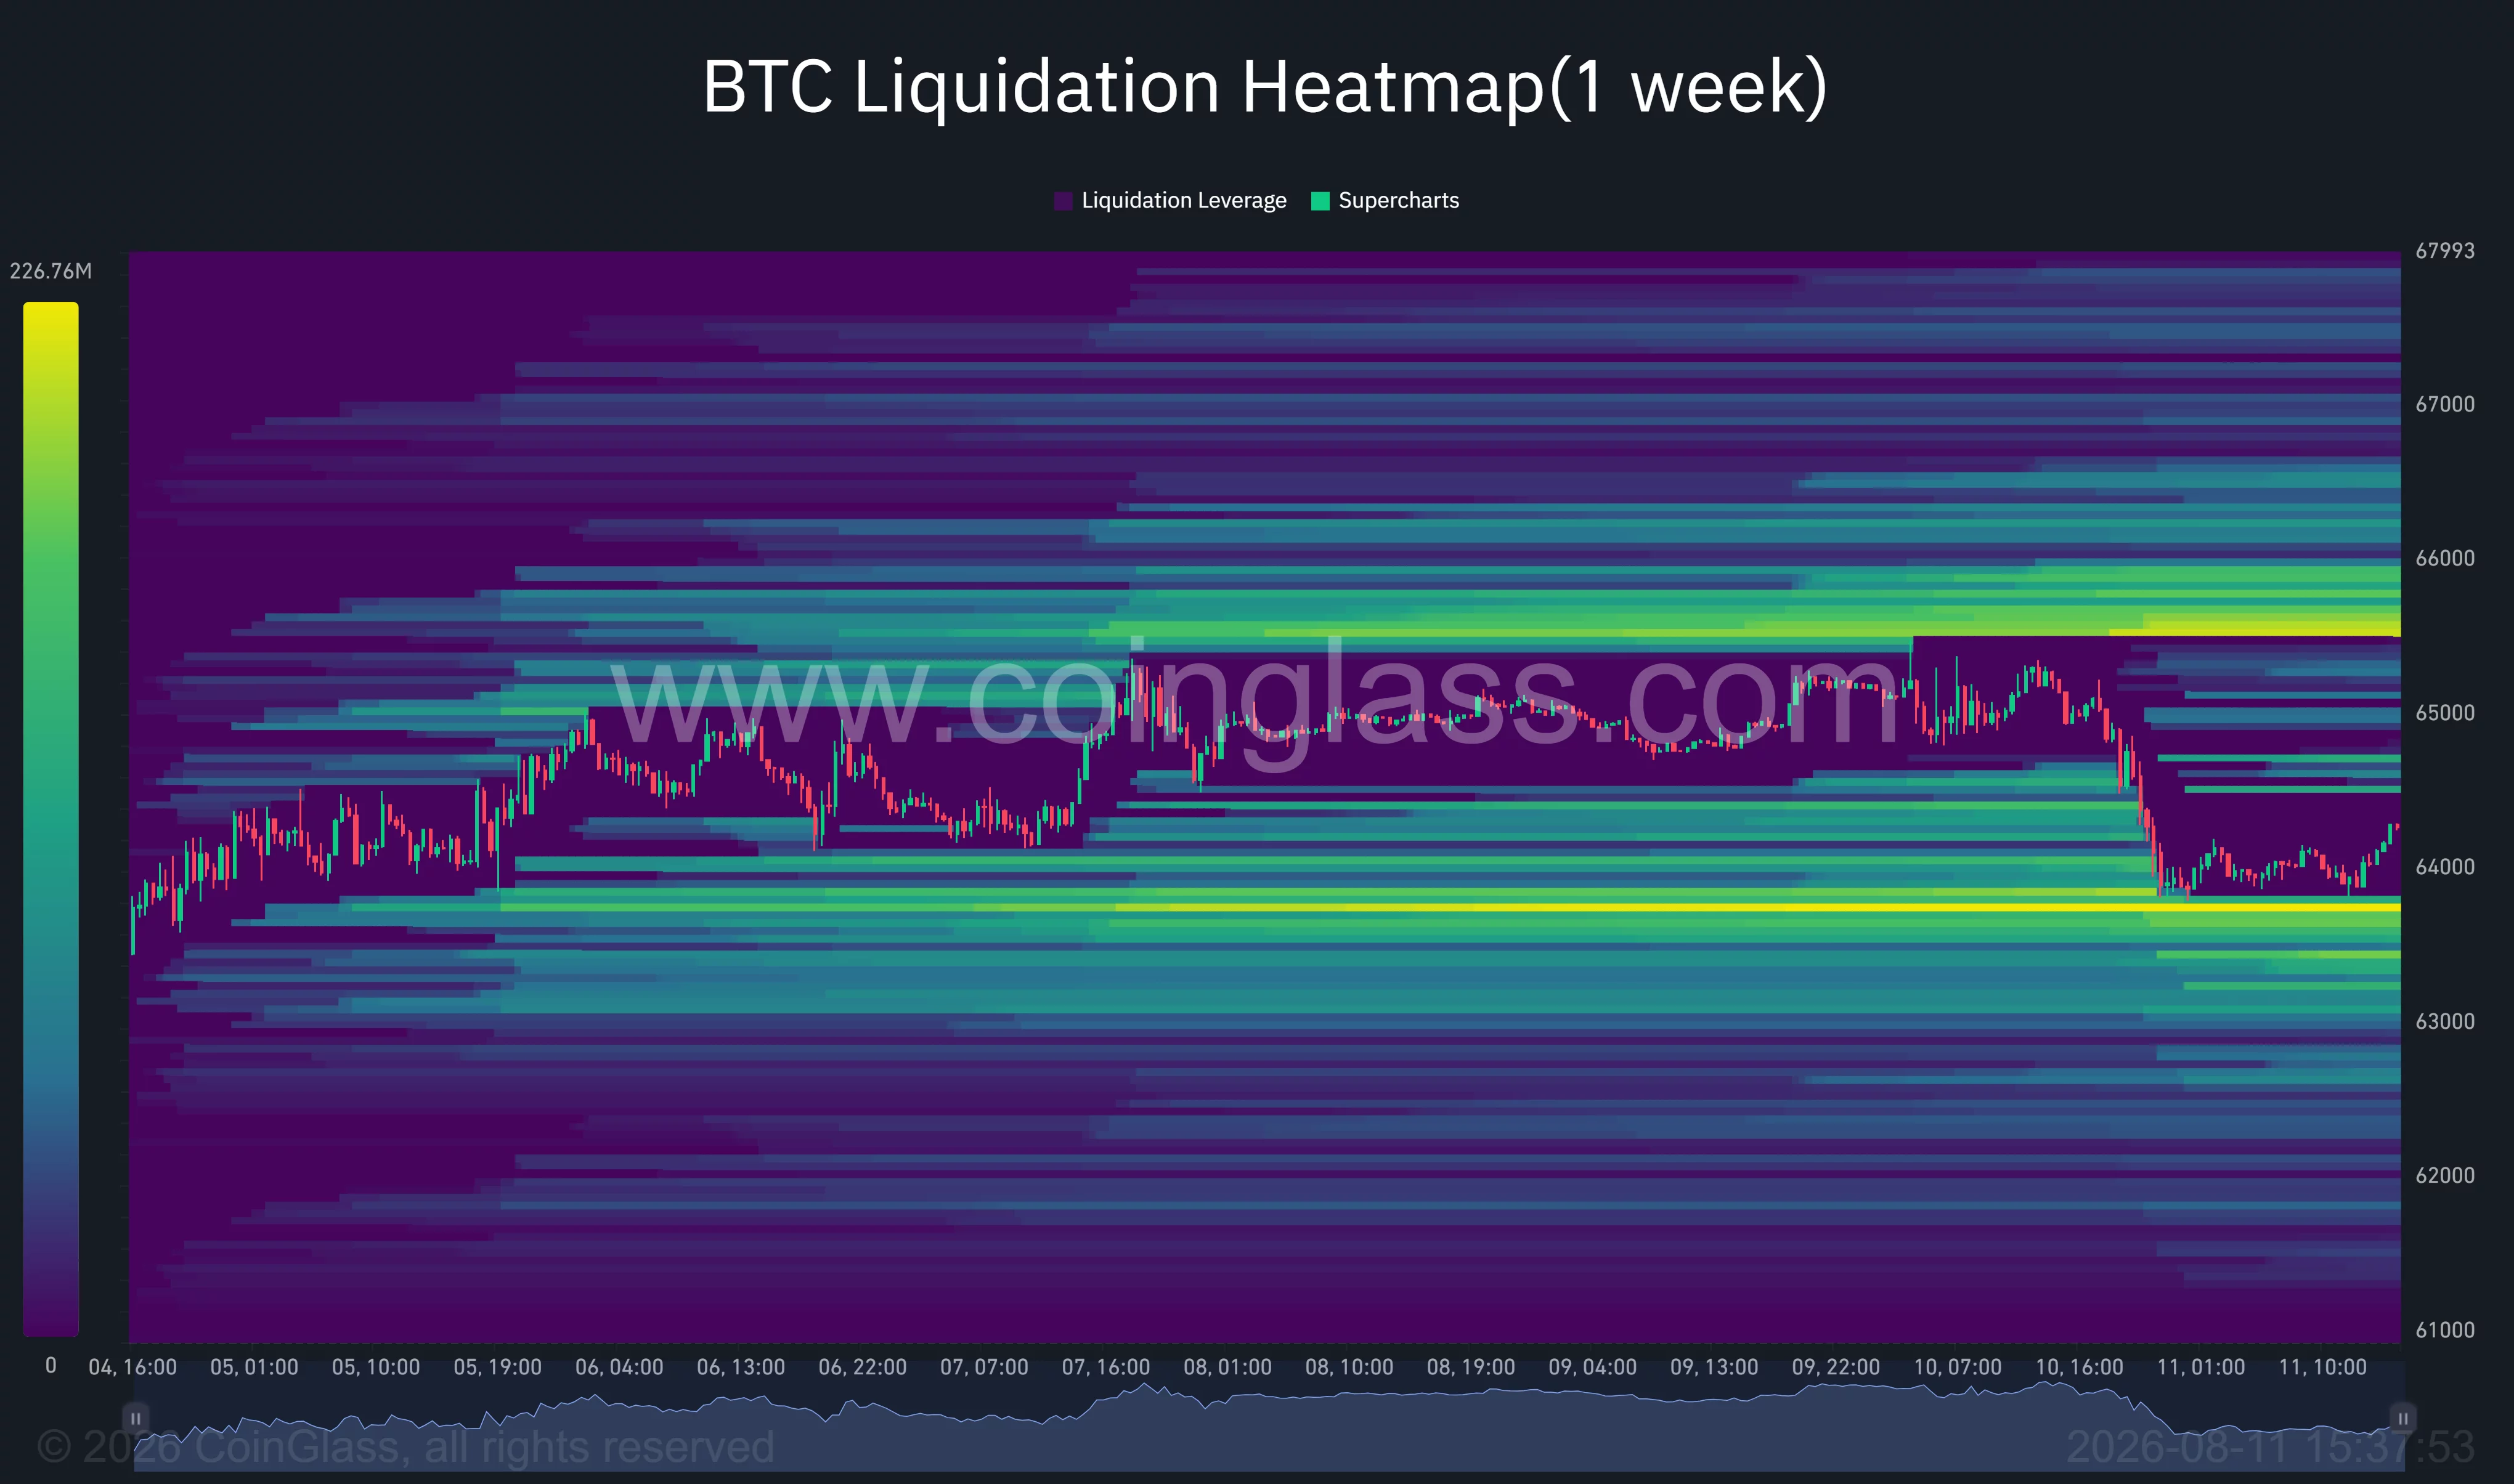
The closest downside liquidity cluster sits around $63,600–$63,800. Bitcoin tested this region during the latest decline but did not produce a sustained breakdown. A second pocket is visible between $63,200 and $63,400.
If $63,700 fails, forced selling could accelerate the move toward the lower cluster. However, the concentration of liquidity can also attract buyers looking to enter after leveraged long positions have been cleared.
The largest nearby upside band sits around $65,500–$65,700. A rebound through $65,000 could therefore trigger short liquidations and help BTC revisit the weekly high. Additional liquidity appears near $66,200 and $67,000, but those levels would require a confirmed breakout from the current range.
This positioning leaves Bitcoin vulnerable to a sharp move in either direction. Price is trading between the closest major liquidation pools, while the upcoming inflation release provides a clear catalyst for volatility.
U.S. CPI could decide Bitcoin’s next move
The U.S. Bureau of Labor Statistics will publish July CPI data on Aug. 12 at 8:30 a.m. Eastern Time. The report could influence expectations for the Federal Reserve’s September policy decision, particularly after rising oil prices renewed inflation concerns.
A cooler reading could ease pressure on Treasury yields and help Bitcoin recover $65,000. Breaking $65,500 would expose the $65,600 liquidation cluster, followed by the 100-day SMA near $67,628.
A hotter reading would strengthen the case for restrictive monetary policy and could pressure speculative assets. Under that outcome, a confirmed loss of $63,900 would shift attention toward $63,200, $62,000, and eventually the $60,000 psychological support.
Regulatory uncertainty also remains in the background. The CLARITY Act’s procedural vote was delayed until Sept. 15, removing a near-term policy catalyst that some U.S. investors had expected before the Senate recess.
For now, Bitcoin remains range-bound rather than decisively bearish. The $63,900–$64,000 zone separates a possible recovery toward $65,500 from a deeper move toward $62,000. The CPI release will likely determine which liquidity pool the market tests first.
Disclosure: This article does not represent investment advice. The content and materials featured on this page are for educational purposes only.
