



XRP price consolidated near $1.48 on Aug. 25 after gaining about 51.5% in seven days, with its 4-hour chart forming a potential bullish pennant that could support another advance if buyers clear resistance near $1.56.
Summary
- XRP price rallied from about $1.00 to an intraday high near $1.69 over seven days.
- The 4-hour chart shows a bullish pennant, with price compressing between converging trendlines.
- A confirmed break above $1.56 could expose resistance at $1.66, $1.76, and $1.86.
- Liquidation clusters near $1.55 and between $1.42 and $1.45 may influence the next move.
XRP price consolidates after 51% rally
According to data from crypto.news, XRP (XRP) price traded around $1.48 at the time of writing after opening the seven-day period at $1.0014 on Aug. 19. The token briefly reached approximately $1.69 before sellers took profits, leaving it about 12% below the weekly high but still up roughly 48% from its starting level.
The rally followed renewed optimism around US crypto regulation after President Donald Trump hosted industry representatives, including Ripple CEO Brad Garlinghouse, at the White House. Trump called on Congress to advance the CLARITY Act, which seeks to divide oversight of digital assets between the Securities and Exchange Commission and the Commodity Futures Trading Commission.
Improved liquidity conditions also supported the broader crypto market. Treasury Secretary Scott Bessent announced an increase in long-dated Treasury buybacks, while the 30-year US Treasury yield retreated from 5.34% to around 5.19%.
Lower bond yields can improve demand for risk assets by reducing the relative return available from government debt. XRP also recorded a reported $18 million daily inflow into US spot exchange-traded funds during the rally, adding a direct source of demand.
The rapid advance pushed XRP through previous resistance around $1.20 and $1.25. However, price action has since narrowed around $1.48 as the market absorbs the move.
XRP’s 4-hour chart shows a bullish pennant
A bullish pennant has appeared on XRP’s 4-hour chart. Price first produced a steep flagpole from approximately $1.00 to $1.58 and then entered a compact consolidation marked by descending resistance and rising support.
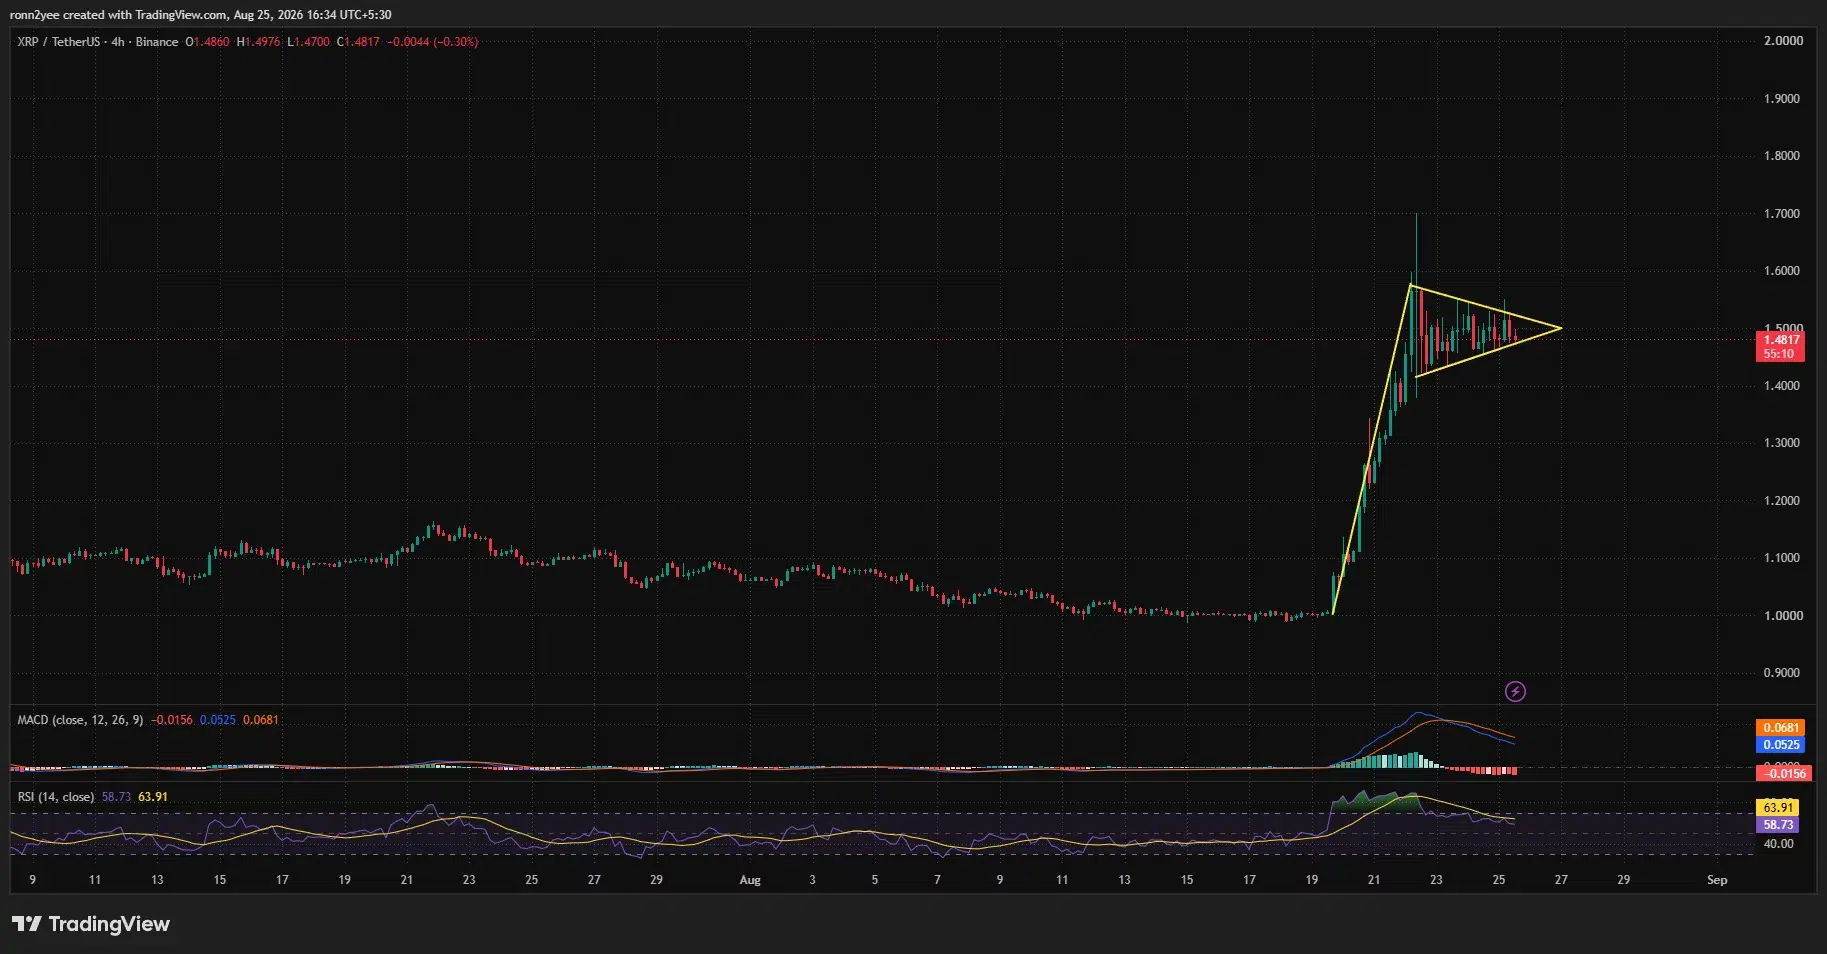
The converging trendlines create the symmetrical triangle that forms the pennant portion of the setup. A strong upward move immediately before the consolidation gives the structure its bullish character.
However, a breakout remains unconfirmed. XRP must close decisively above the pennant’s upper boundary and attract higher trading volume before traders can treat the continuation signal as active.
A traditional measured move takes the height of the flagpole and adds it to the breakout area. XRP’s roughly $0.58 advance from $1.00 to $1.58 produces a theoretical target slightly above $2 if the breakout begins near $1.50. Technical targets are projections, however, and do not guarantee that the price will reach them.
Crypto analyst Altcoin Sherpa also described the consolidation as constructive despite volatile trading on shorter timeframes.
“I think this consolidation is good and healthy though. $2 on this next move imo.”
The analyst’s $2 forecast broadly aligns with the pennant’s measured target, although XRP must first overcome several resistance levels below that price.
XRP momentum cools as buyers retain an edge
The 4-hour relative strength index stood at 58.73, down from a recent overbought reading. A reading above 50 still indicates that bullish momentum has not disappeared, while the retreat from overbought territory suggests the market is working through the excess created by the initial surge.
The moving average convergence divergence indicator presents a more cautious short-term signal. The MACD line had fallen below its signal line, while the histogram stood at negative 0.0156. The bearish crossover indicates that upward momentum has weakened during the pennant’s formation.
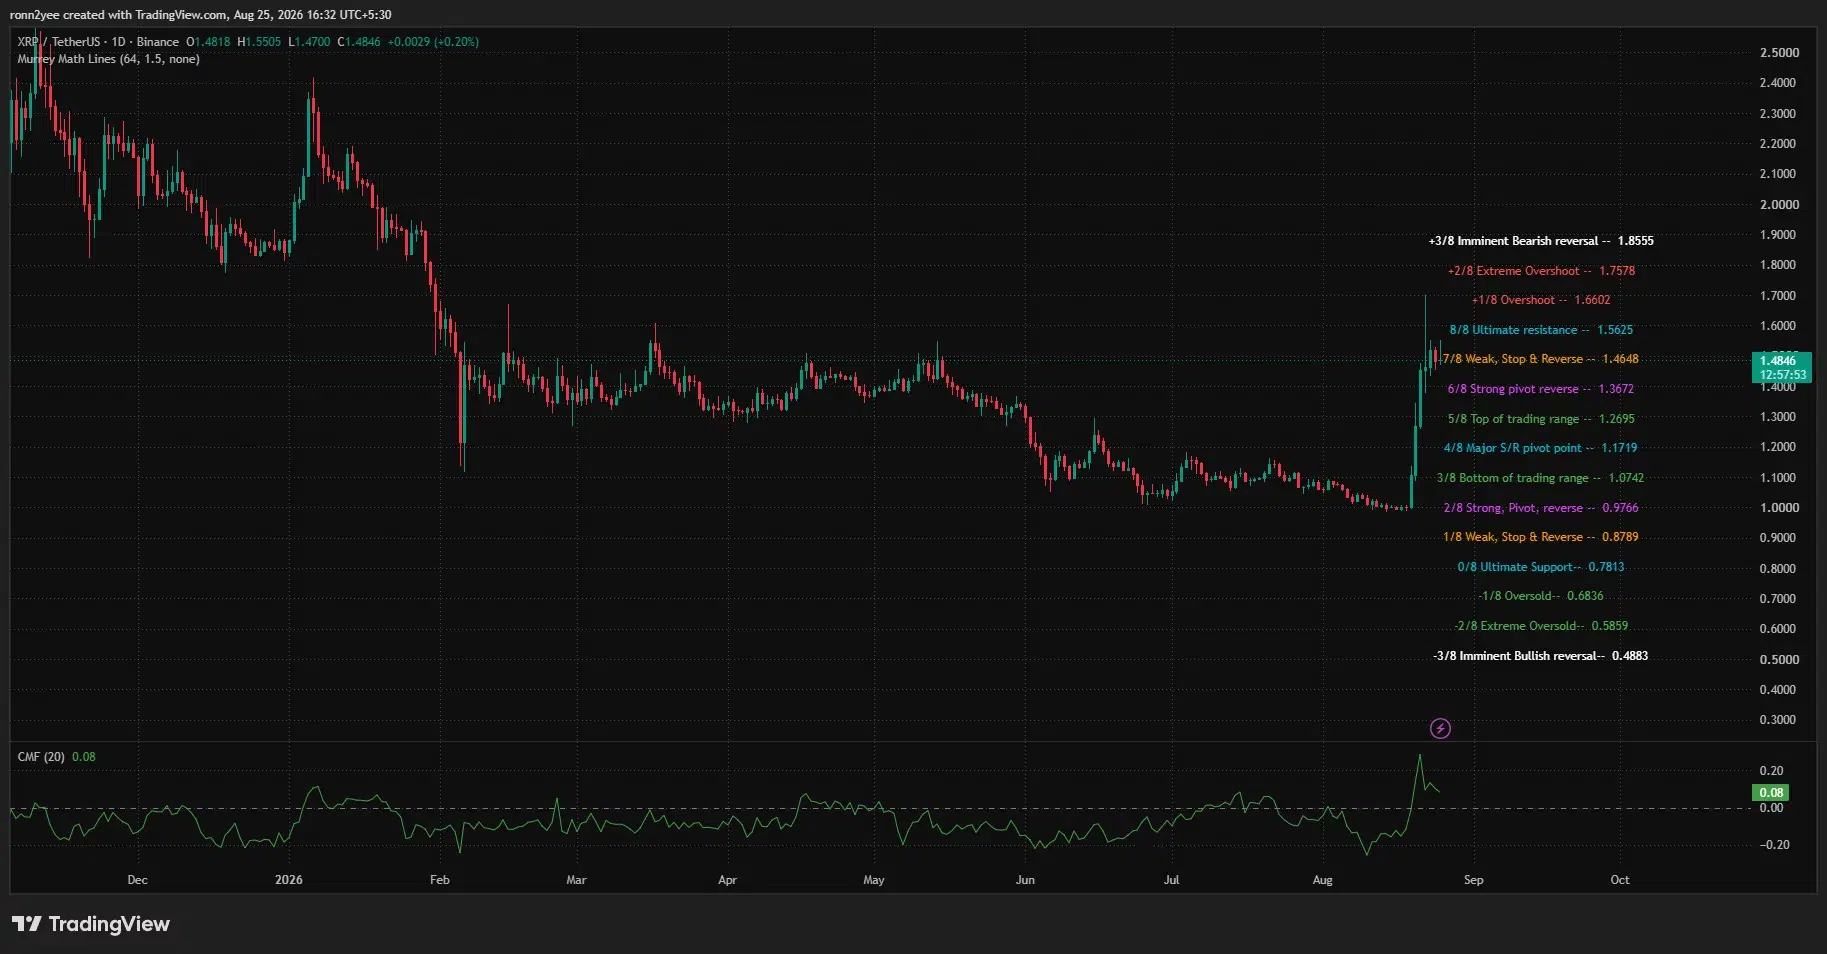
Daily money flow remains positive. The Chaikin Money Flow indicator registered 0.08, showing that buying pressure continued to exceed selling pressure despite the pullback from $1.69. A move below zero would weaken that reading and suggest capital is leaving the market.
Network data supplied by analyst Ali Charts adds another measure of activity. Citing Santiment data, the analyst said XRP active addresses increased 654.71%, from 47,180 to 356,070. Rising address activity can accompany stronger market participation and volatility, but it does not show whether users are buying or selling.
Whale wallets reportedly accumulated another 380 million XRP during the week. If sustained, such purchases could reduce available supply, though the market would need updated exchange-balance and wallet data to establish whether the accumulation continued during consolidation.
XRP resistance begins at $1.56
The daily chart places immediate resistance at the Murrey Math level of $1.5625. A daily close above that threshold would also take XRP beyond the recent pennant ceiling, strengthening the case for bullish continuation.
Further resistance sits at $1.6602, close to the weekly high, followed by $1.7578 and $1.8555. XRP would need to clear all three areas before challenging the psychological $2 level.
The three-day liquidation heatmap shows a notable concentration of leveraged positions between approximately $1.54 and $1.56. Price can move toward dense liquidity zones as positions are closed, meaning a push into that region could trigger short liquidations and help accelerate an upside breakout.
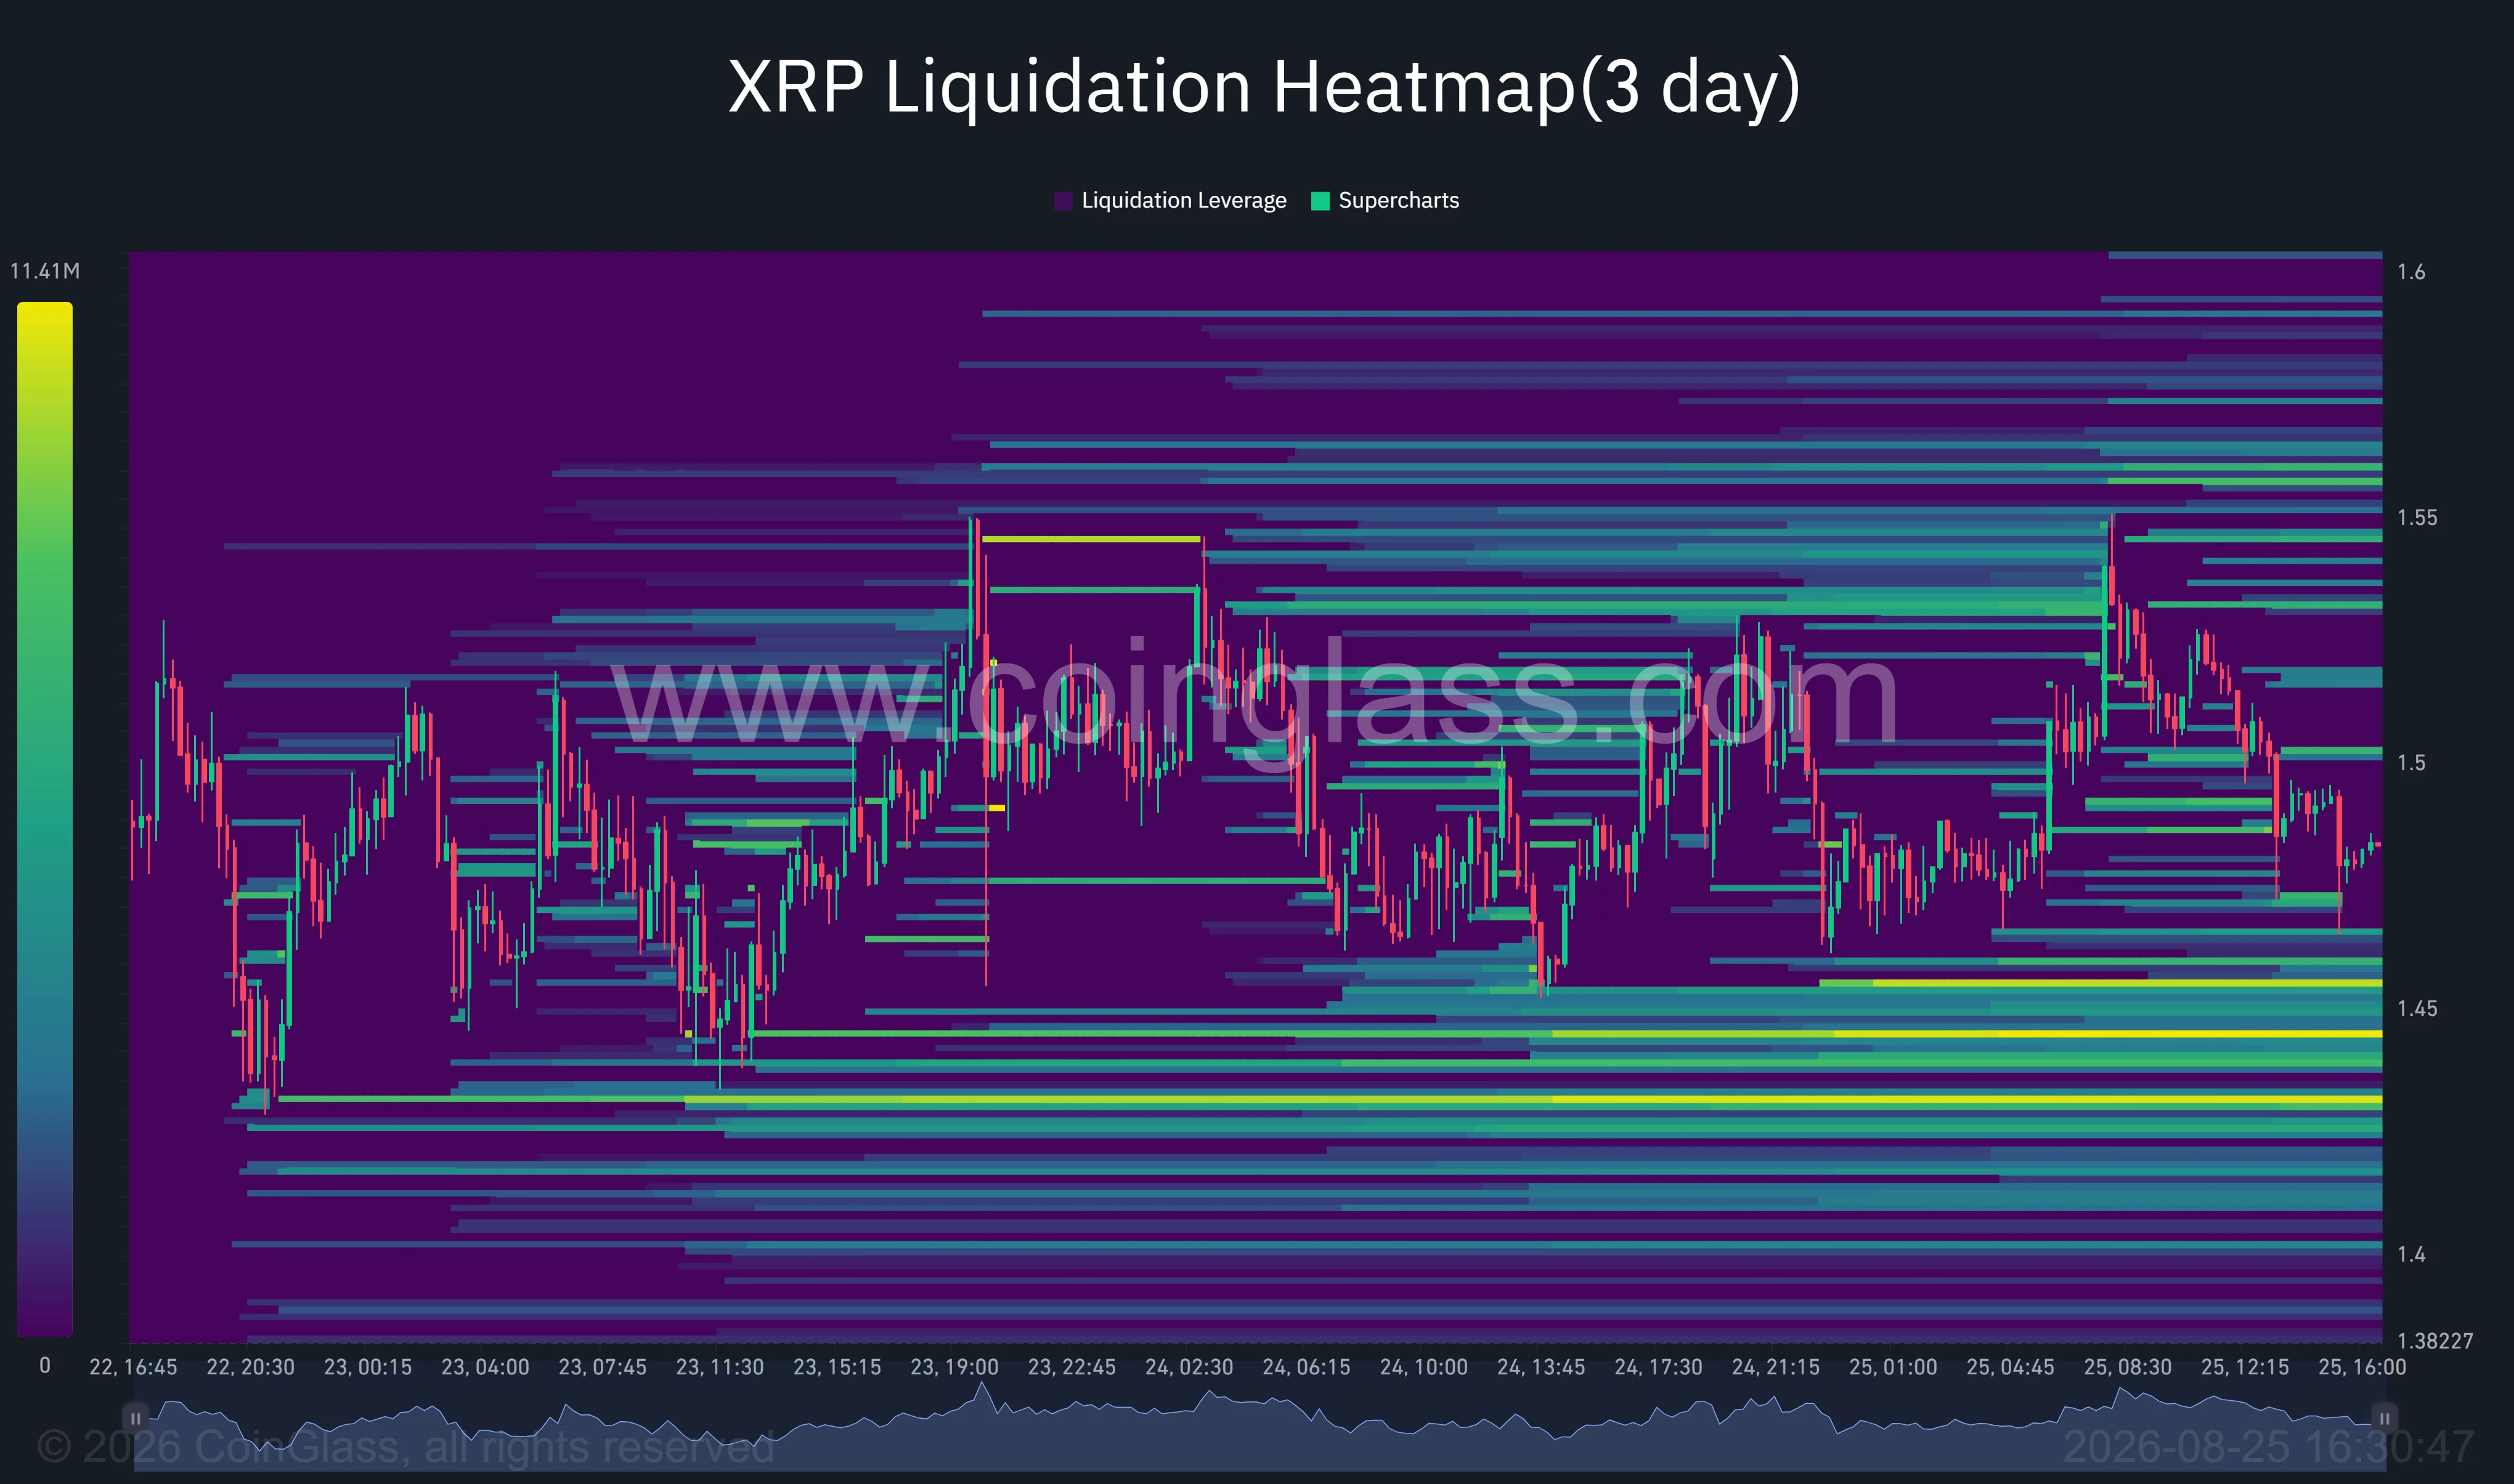
Downside liquidity is more concentrated between $1.42 and $1.45, with another bright band close to $1.43. A decline into that area could liquidate leveraged long positions and deepen the pullback.
The pennant’s rising lower trendline offers initial support around $1.46. Below it, the daily chart identifies $1.3672 as the next major reversal level, followed by $1.2695. A sustained break below $1.3672 would invalidate the current 4-hour pennant and raise the risk that XRP’s post-rally consolidation is turning into a larger correction.
For the bullish scenario, XRP needs a high-volume close above $1.56, followed by a successful retest of that level as support. Failure to hold $1.46 would instead expose the lower liquidity clusters and shift attention toward $1.37.
Disclosure: This article does not represent investment advice. The content and materials featured on this page are for educational purposes only.
