



Pump.fun’s PUMP token has gained more than 35% over the past week, breaking above key daily moving averages as buyers target the upper boundary of a rising channel near $0.0028.
Summary
- PUMP price climbed above $0.0025 after trading near $0.0018 on July 30.
- The token now trades above its 20-, 50-, 100- and 200-day moving averages.
- 4-hour RSI reached 76.71, warning that the rally may be overheated.
- Holding $0.0022–$0.0020 would keep the short-term bullish structure intact.
PUMP price extends its weekly rally
According to data from crypto.news, PUMP price traded near $0.00252 on Aug. 5 after reaching an intraday high of roughly $0.00256. The move lifted its weekly gain above 35% and marked a sharp recovery from the July 30 area near $0.0018.
The daily chart shows that PUMP has broken above a descending trendline that had capped the token since early 2026. Buyers also cleared the horizontal resistance area between $0.0022 and $0.0024, turning the former ceiling into a potential support zone.
This breakout followed a base-building period between $0.0013 and $0.0016 during June and early July. PUMP has since formed a series of higher lows, showing a shift from its broader downtrend toward accumulation.
Trading activity also increased as the breakout developed. The supplied market data showed daily volume rising above $153 million, suggesting the advance was supported by stronger participation rather than thin-market price movement.
Buybacks support demand after the July unlock
Pump.fun’s revenue-funded repurchase program remains one of the main catalysts behind the recovery. The platform says half of its protocol fees are allocated to buying and burning PUMP, creating recurring spot demand when network activity rises.
Pump.fun’s official token page showed annualized revenue of about $356 million, or approximately $976,500 per day, on Aug. 5. At the stated 50% allocation, that would direct close to $488,000 toward daily repurchases if revenue remained stable.
The rally also comes after a major July token distribution. Pump.fun distributed about 57.28 billion PUMP across 121 wallets in mid-July, adding roughly $86.5 million in previously locked tokens to team and investor wallets at the time.
Price weakness ahead of the distribution suggested traders had already reduced exposure before the new supply entered circulation. The subsequent recovery indicates that spot demand and buybacks have so far absorbed at least part of the potential selling pressure.
PUMP charts put $0.0028 in focus
PUMP’s daily chart has turned constructive after the token moved above all four moving averages shown. The 20-day simple moving average stands near $0.0020, while the 50- and 100-day averages sit around $0.00172 and $0.00168.
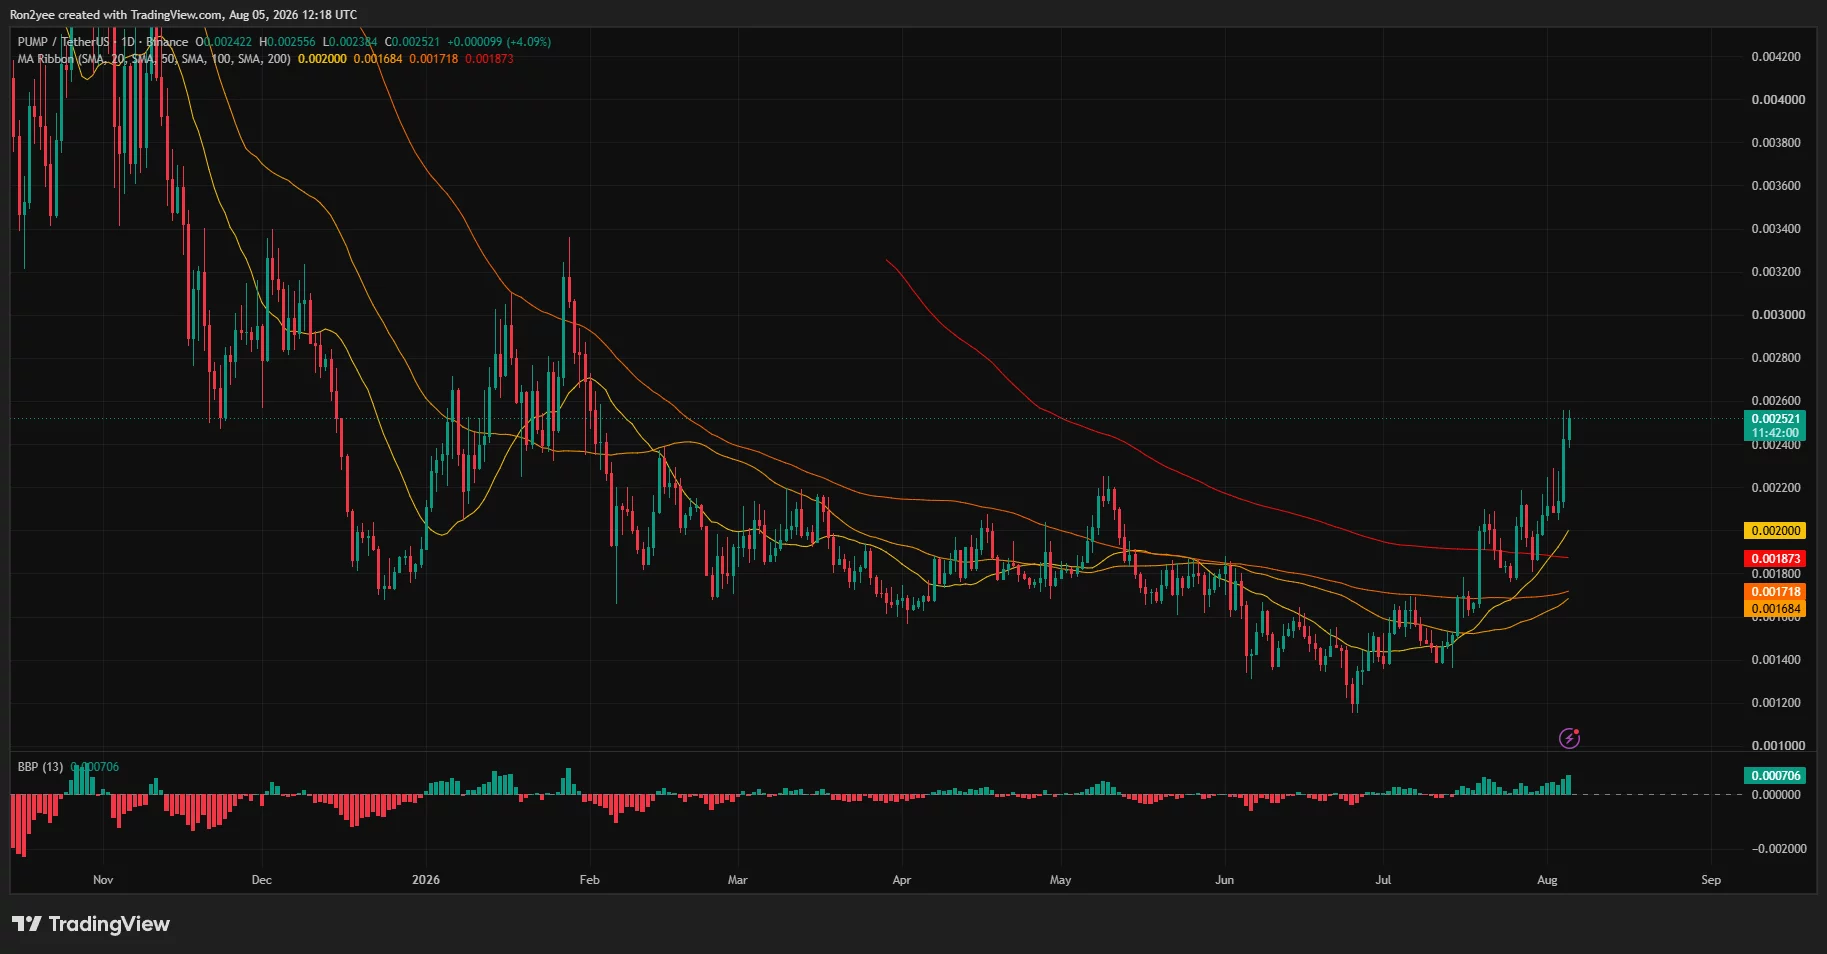
The 200-day average at approximately $0.00187 represents the most important longer-term threshold. PUMP’s move above it suggests the broader trend is improving, although buyers still need to defend the breakout on a daily closing basis.
On the 4-hour chart, PUMP is trading near the upper boundary of an ascending channel. That resistance line reaches approximately $0.00265 in the immediate term and rises toward $0.0028 over the coming sessions.
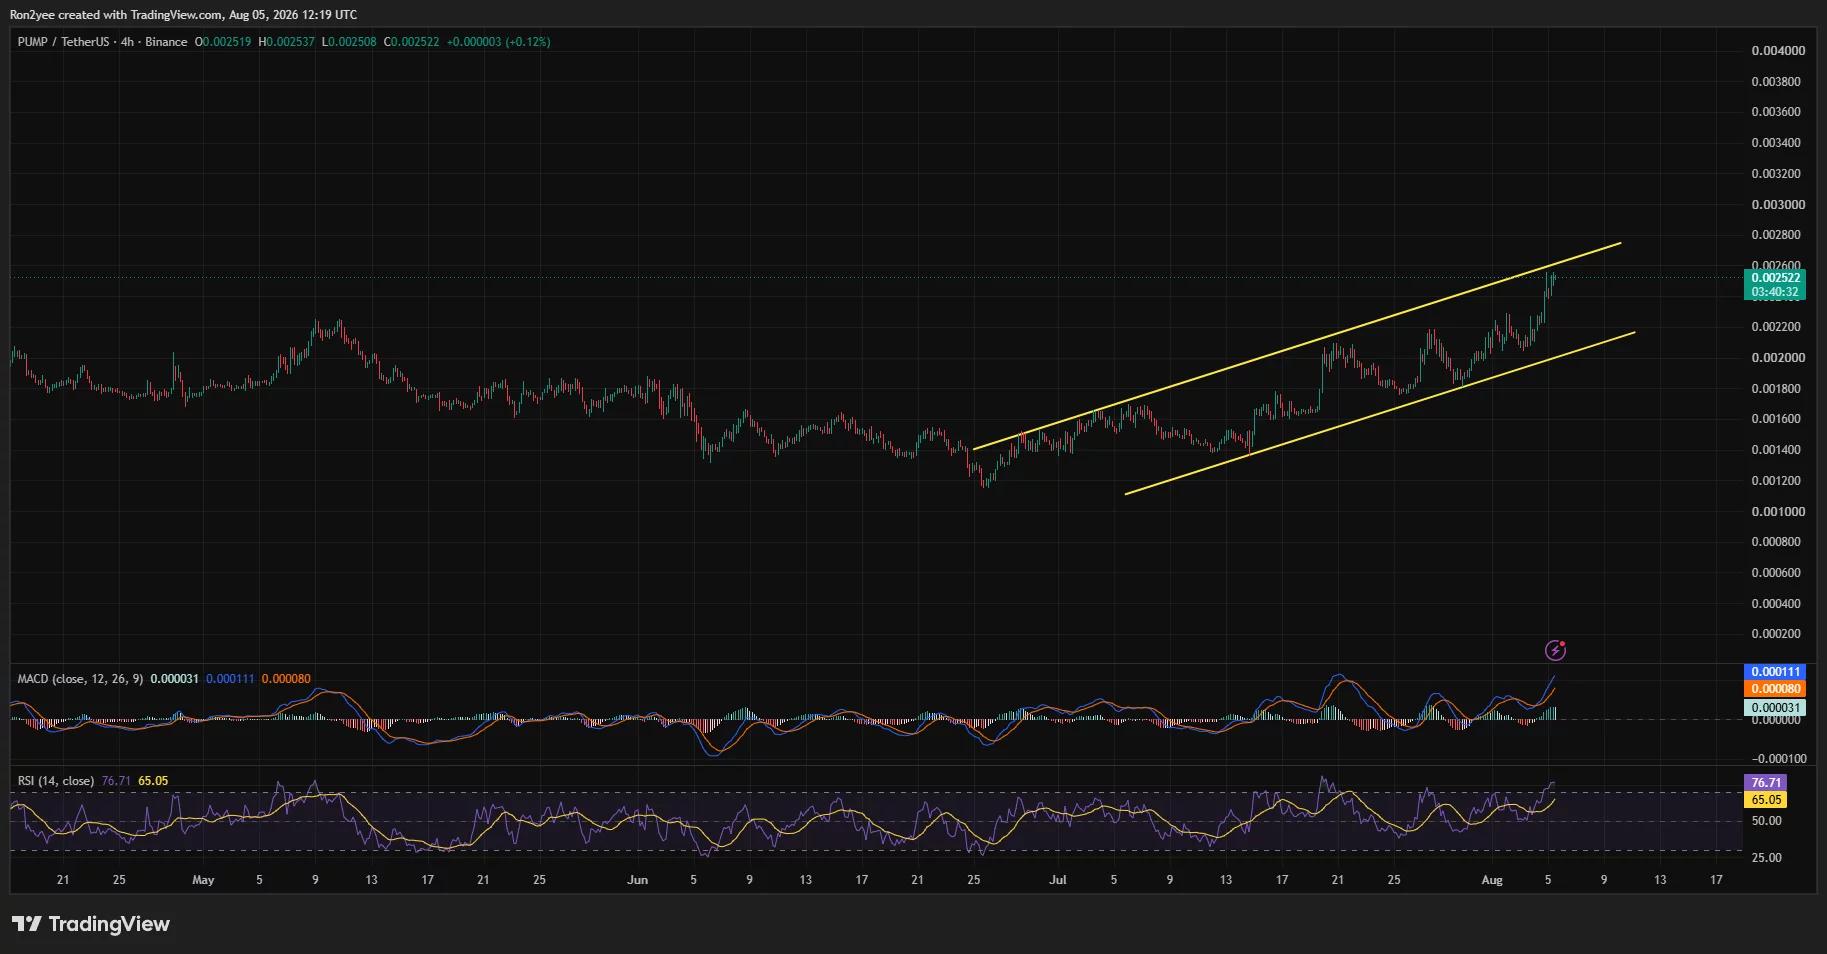
Momentum favors buyers. The 4-hour moving average convergence divergence line stood at 0.000111, above its 0.000080 signal line, while the positive histogram widened to 0.000031.
However, the 4-hour relative strength index has climbed to 76.71. A reading above 70 generally signals overbought conditions and raises the probability of short-term profit-taking or consolidation.
Bulls need to defend the breakout zone
Crypto trader Daan Crypto Trades said PUMP had shown “lots of relative strength” following its breakout and identified the former resistance area as the key level for buyers.
“Beautiful move after the breakout. Moving fast after underperforming for a while ahead of that big July unlock.”
He added that bulls must hold above the red resistance zone shown on his chart to maintain momentum. Daan Crypto Trades
A sustained move above $0.0026 could open the path toward $0.0028, matching the upper channel boundary. Clearing that target would expose the psychological $0.0030 level, last approached during earlier rebounds.
On the downside, $0.0022 is the first support to watch. A deeper pullback could test the 20-day moving average at $0.0020, while a daily close below the 200-day average near $0.00187 would weaken the bullish reversal.
PUMP’s 3-day liquidation heatmap shows concentrated leverage above the current price between $0.00257 and $0.00260. A move through this area could force short liquidations and accelerate the advance toward $0.0026 before bulls target $0.0028.
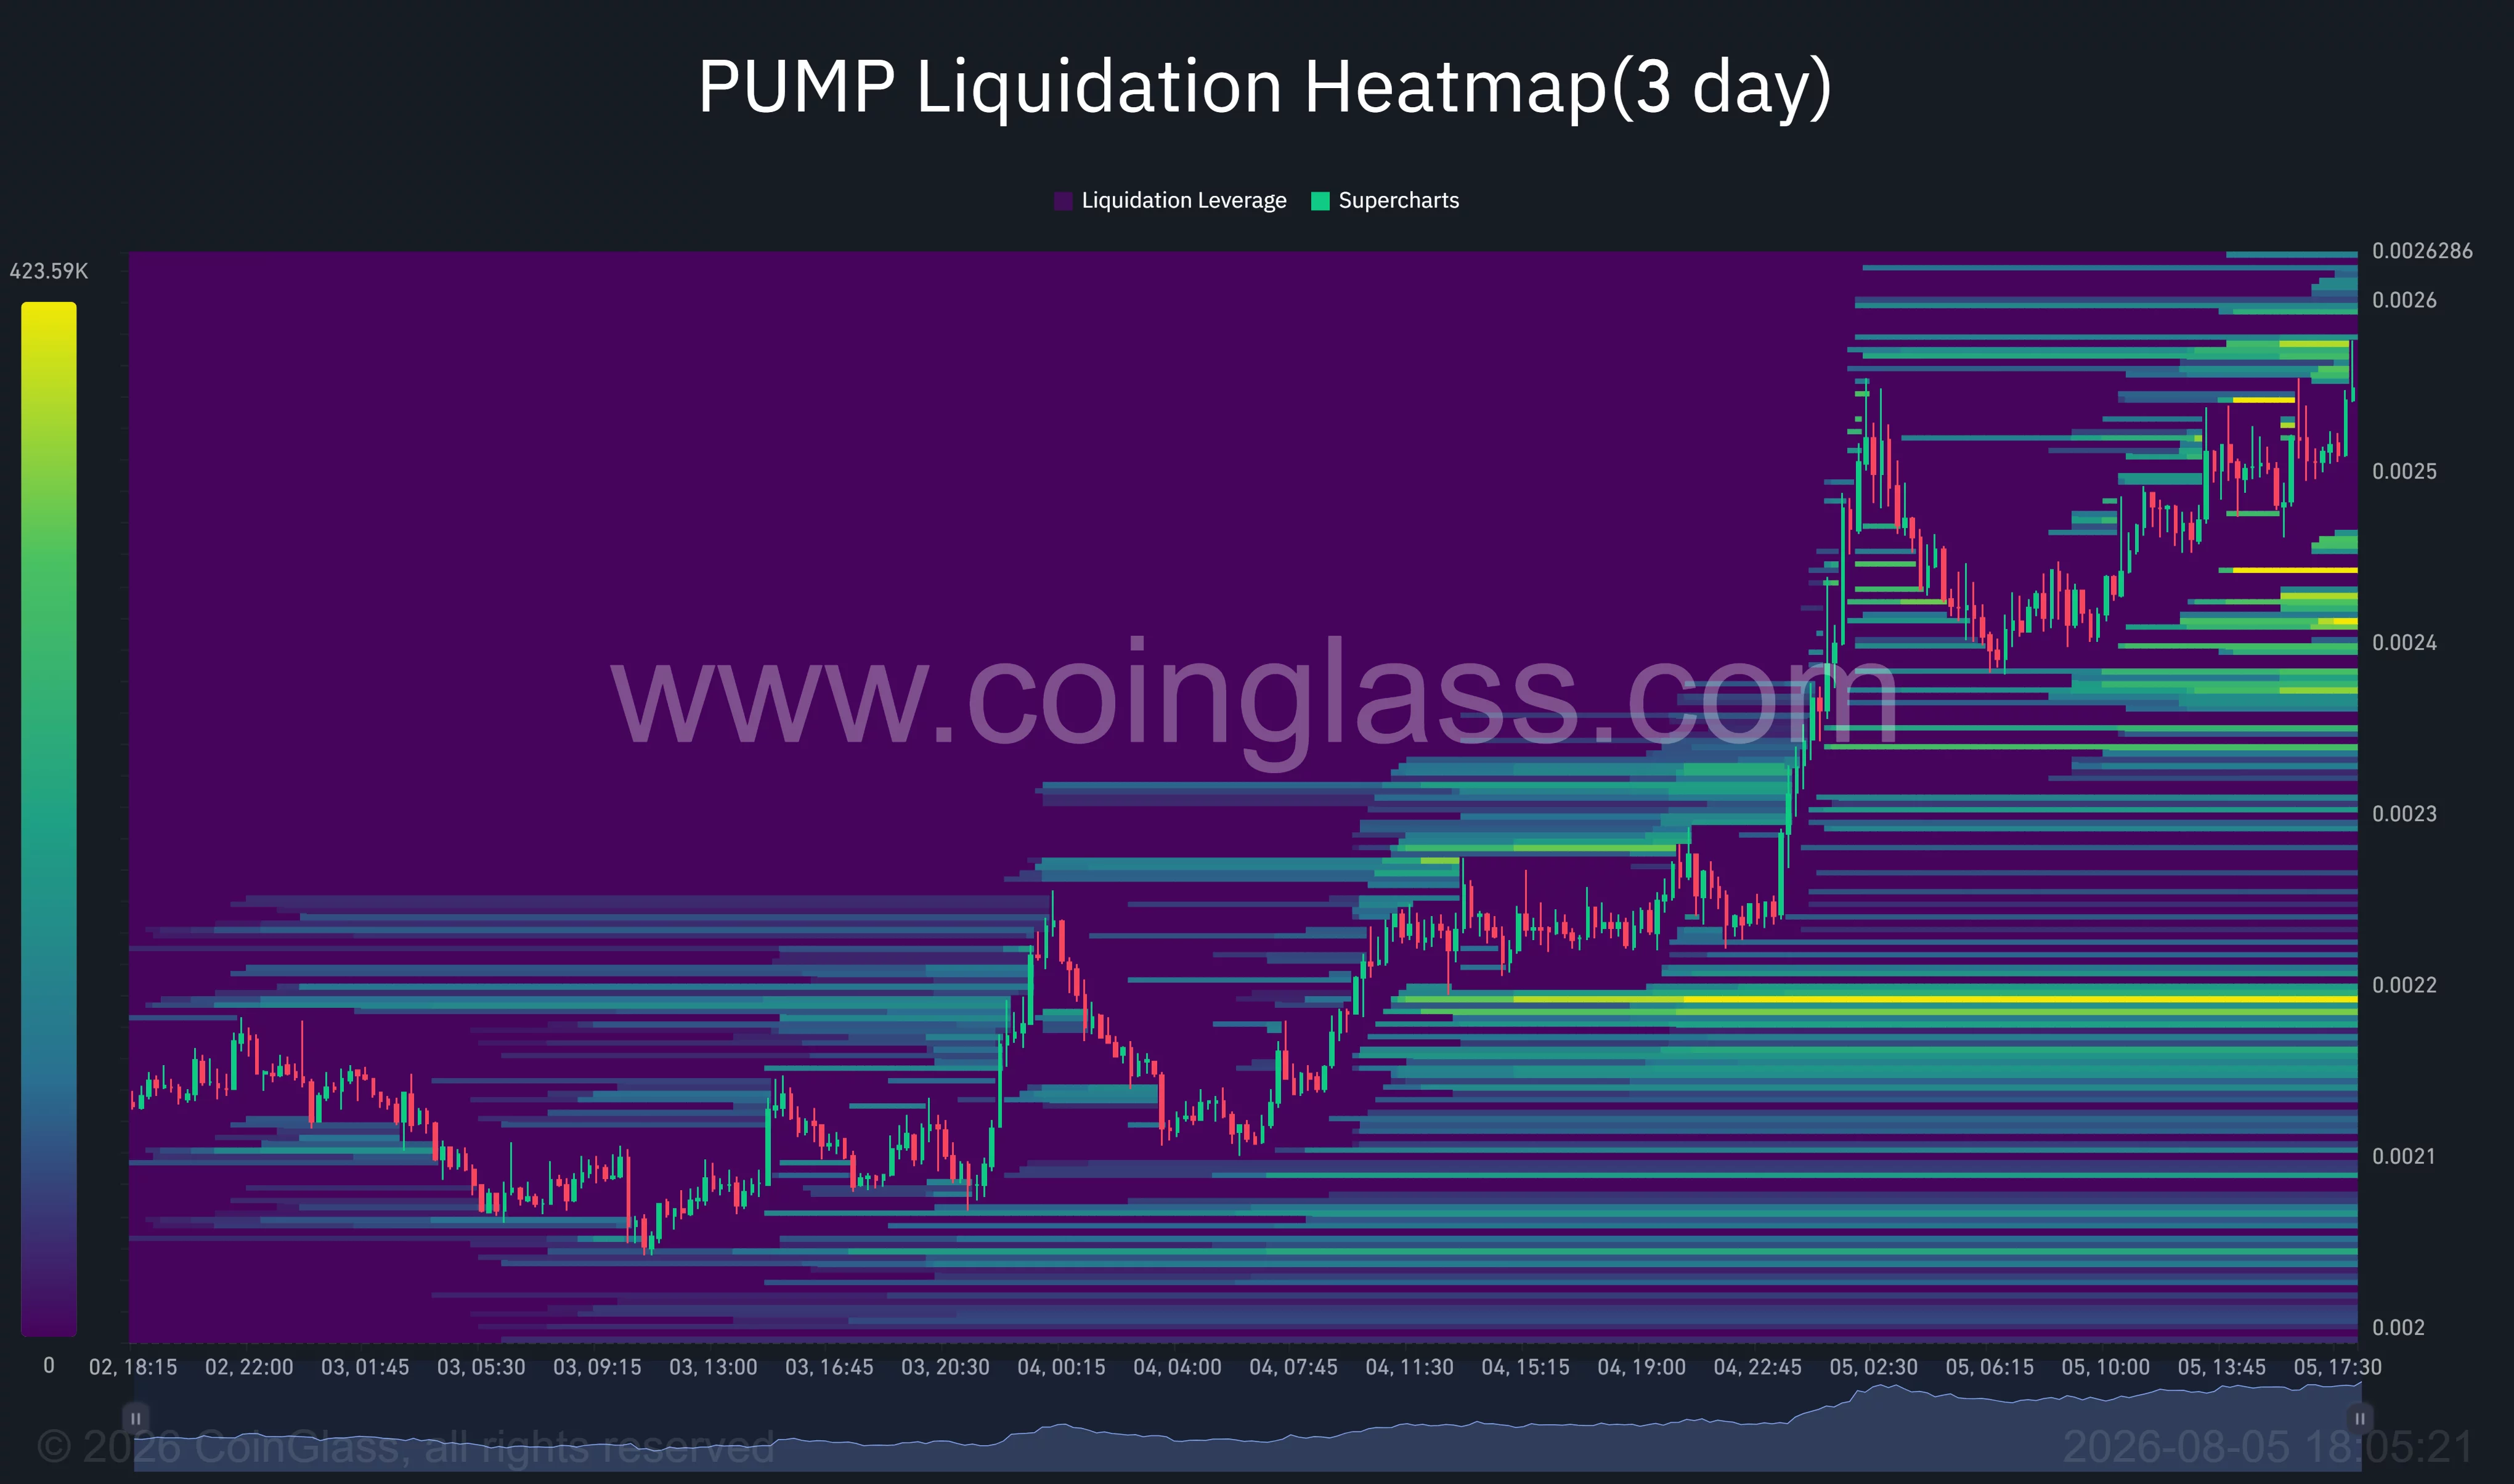
The largest downside liquidity cluster sits around $0.00218–$0.00220, close to the breakout support identified on the price charts. Additional clusters appear near $0.00238 and $0.00234. If momentum weakens, these levels could attract price and expose leveraged long positions to liquidation.
US traders face high volatility risk
For US traders, PUMP remains a speculative token closely tied to memecoin activity and Solana liquidity. Buybacks can support demand, but they do not remove the risks created by token unlocks, sharp momentum reversals, or declining platform revenue.
The overbought 4-hour RSI makes chasing the current move particularly risky. Whether PUMP reaches $0.0028 will likely depend on buyers holding the $0.0022–$0.0020 breakout area after the initial momentum cools.
Disclosure: This article does not represent investment advice. The content and materials featured on this page are for educational purposes only.
