



Ethereum price fell 2% to around $1,847 on Aug. 3 after another rejection near key moving averages left the $1,800 support zone exposed.
Summary
- Ethereum price fell 2.04%, reaching an intraday low of $1,828.
- ETH remains below its 50-day and 100-day moving averages at $1,889 and $1,927.
- 4-hour MACD and Chaikin Money Flow readings show weak momentum and continued selling pressure.
- A break below $1,800 could bring $1,785 and $1,700 into focus.
ETH slides after failing to reclaim $1,900
According to data from crypto.news, Ethereum (ETH) price traded at $1,847 at the time of writing, down 2.04% over the previous 24 hours. The token moved between an intraday high of $1,886 and a low of $1,829 on Binance.
The decline extended ETH’s retreat from its July 27 high near $1,975. Buyers have now failed several times to sustain a move above the resistance zone between $1,950 and $1,975.
ETH briefly rebounded after touching $1,828, but the recovery stalled around $1,850. That left the token near the lower end of its recent trading range and inside the closely watched $1,800–$1,850 support area.
The broader daily structure also remains defensive. Ethereum trades below its 50-day simple moving average at $1,889, its 100-day SMA at $1,927, and its 200-day SMA at $2,089.
Weak liquidity deepens Ethereum’s sell-off
The immediate pressure came from Ethereum’s failure to reclaim the moving-average resistance between $1,889 and $1,927. Sellers entered after the latest attempt faded, pushing ETH below $1,850 and toward its Aug. 3 low.
The 4-hour chart shows the price rolling over after forming a broad curved top below $1,975. Lower highs since late July suggest that buying demand has weakened, although ETH must still break below $1,800 to confirm a larger bearish continuation.
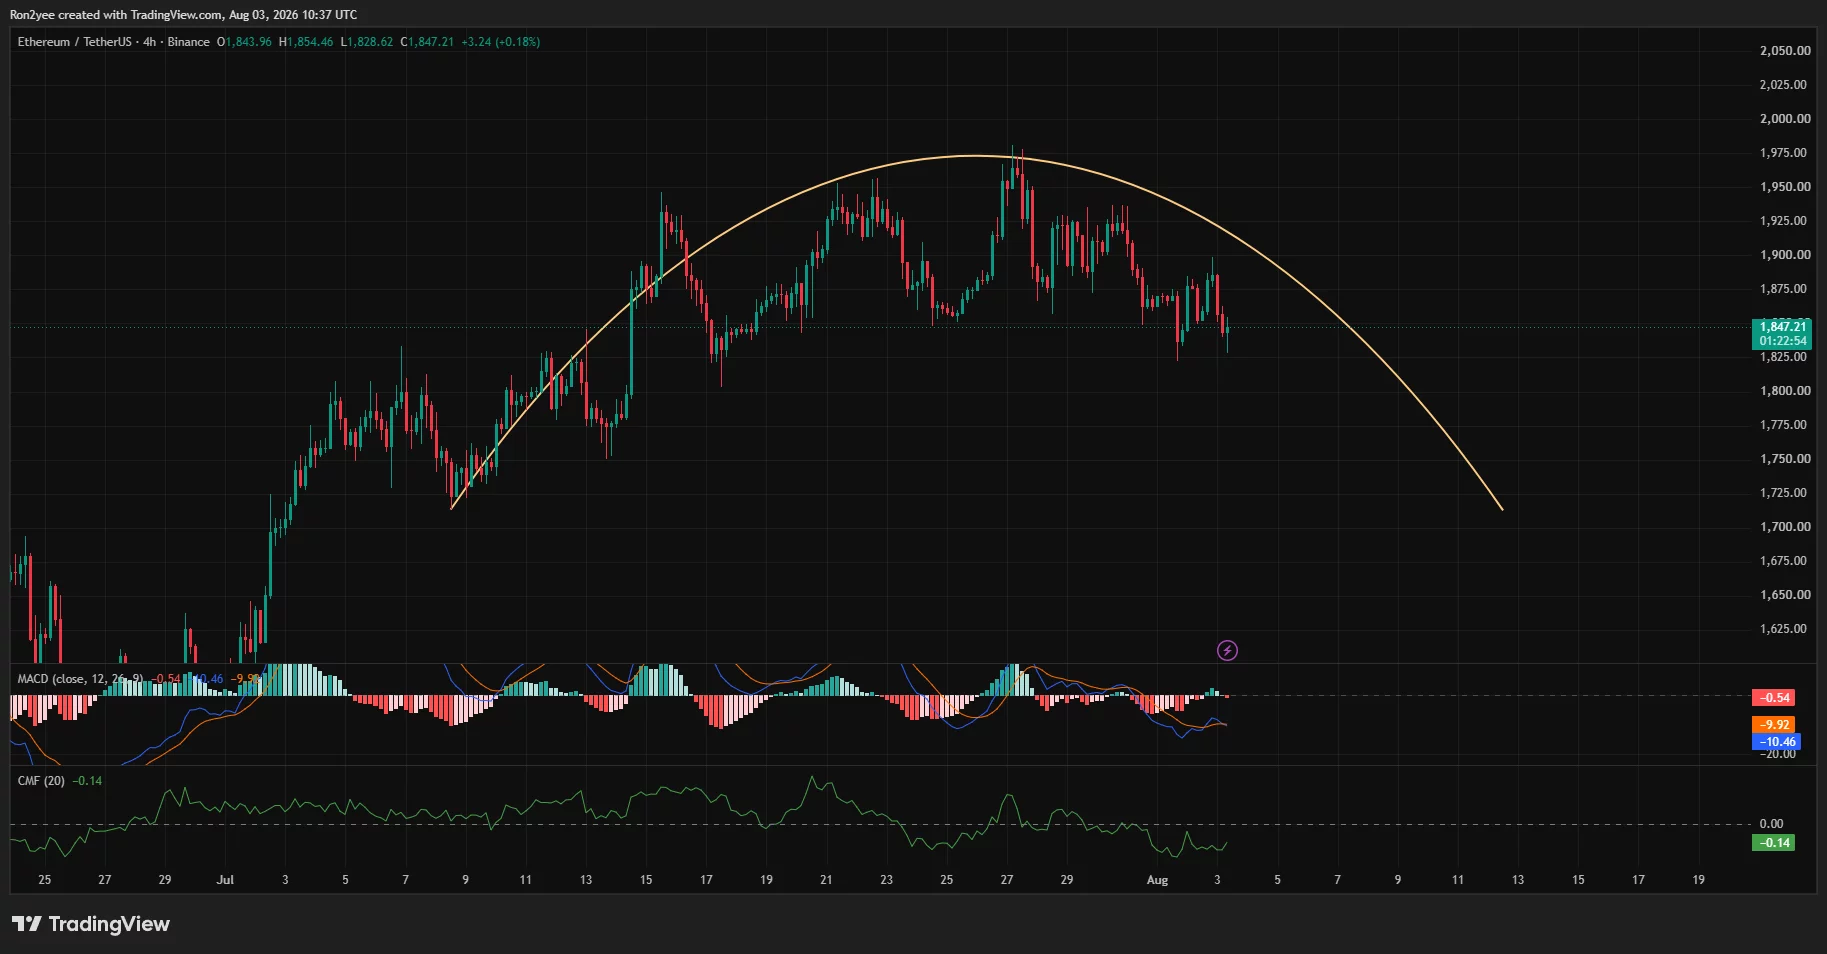
Momentum indicators support the cautious outlook. The 4-hour Moving Average Convergence Divergence remains below zero, with the MACD line near -10.46 and the signal line at about -9.92.
Chaikin Money Flow stands at -0.14. The negative reading indicates that selling volume has outweighed buying volume over the indicator’s measurement period.
Ethereum also faces broader liquidity pressure. A sharp weekly decline in Binance stablecoin netflows suggests less immediately available capital is entering the exchange, potentially reducing the buy-side liquidity available during market declines. However, exchange flows can change quickly and do not determine price direction alone.
Longer-term concerns include weaker institutional demand for Ethereum products relative to Bitcoin and lower mainnet fee revenue as activity shifts toward Layer-2 networks. These factors have weakened Ethereum’s investment narrative, but the current move remains primarily tied to the chart rejection and wider risk-off positioning.
Losing $1,800 could expose ETH to $1,700
The first support range sits between $1,828 and $1,800. ETH has already attracted buyers near the upper part of that zone, but repeated tests could weaken the remaining demand.
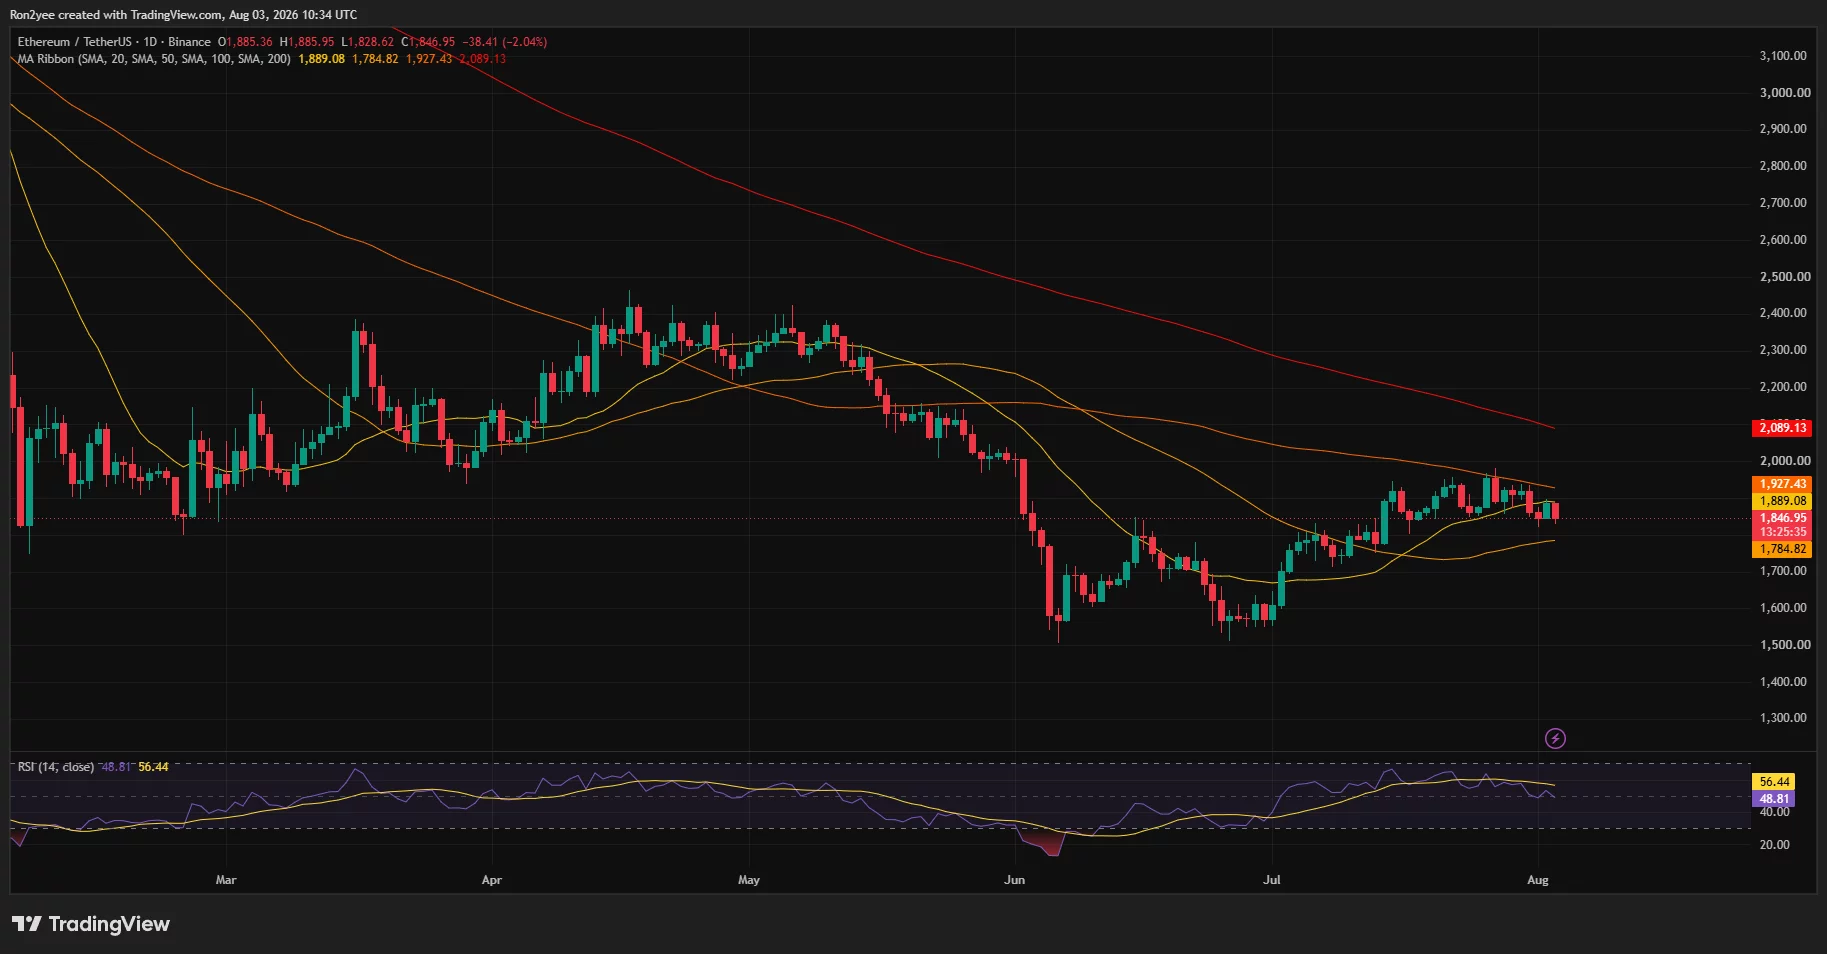
Ethereum’s lower daily moving-average ribbon stands near $1,785. A daily close below that level would strengthen the bearish setup and expose $1,700, followed by the June accumulation region around $1,550–$1,600.
CoinGlass’ 24-hour liquidation heatmap shows nearby leveraged-position clusters around $1,840, $1,820 and $1,810. A move through those levels could liquidate leveraged long positions and accelerate short-term volatility.
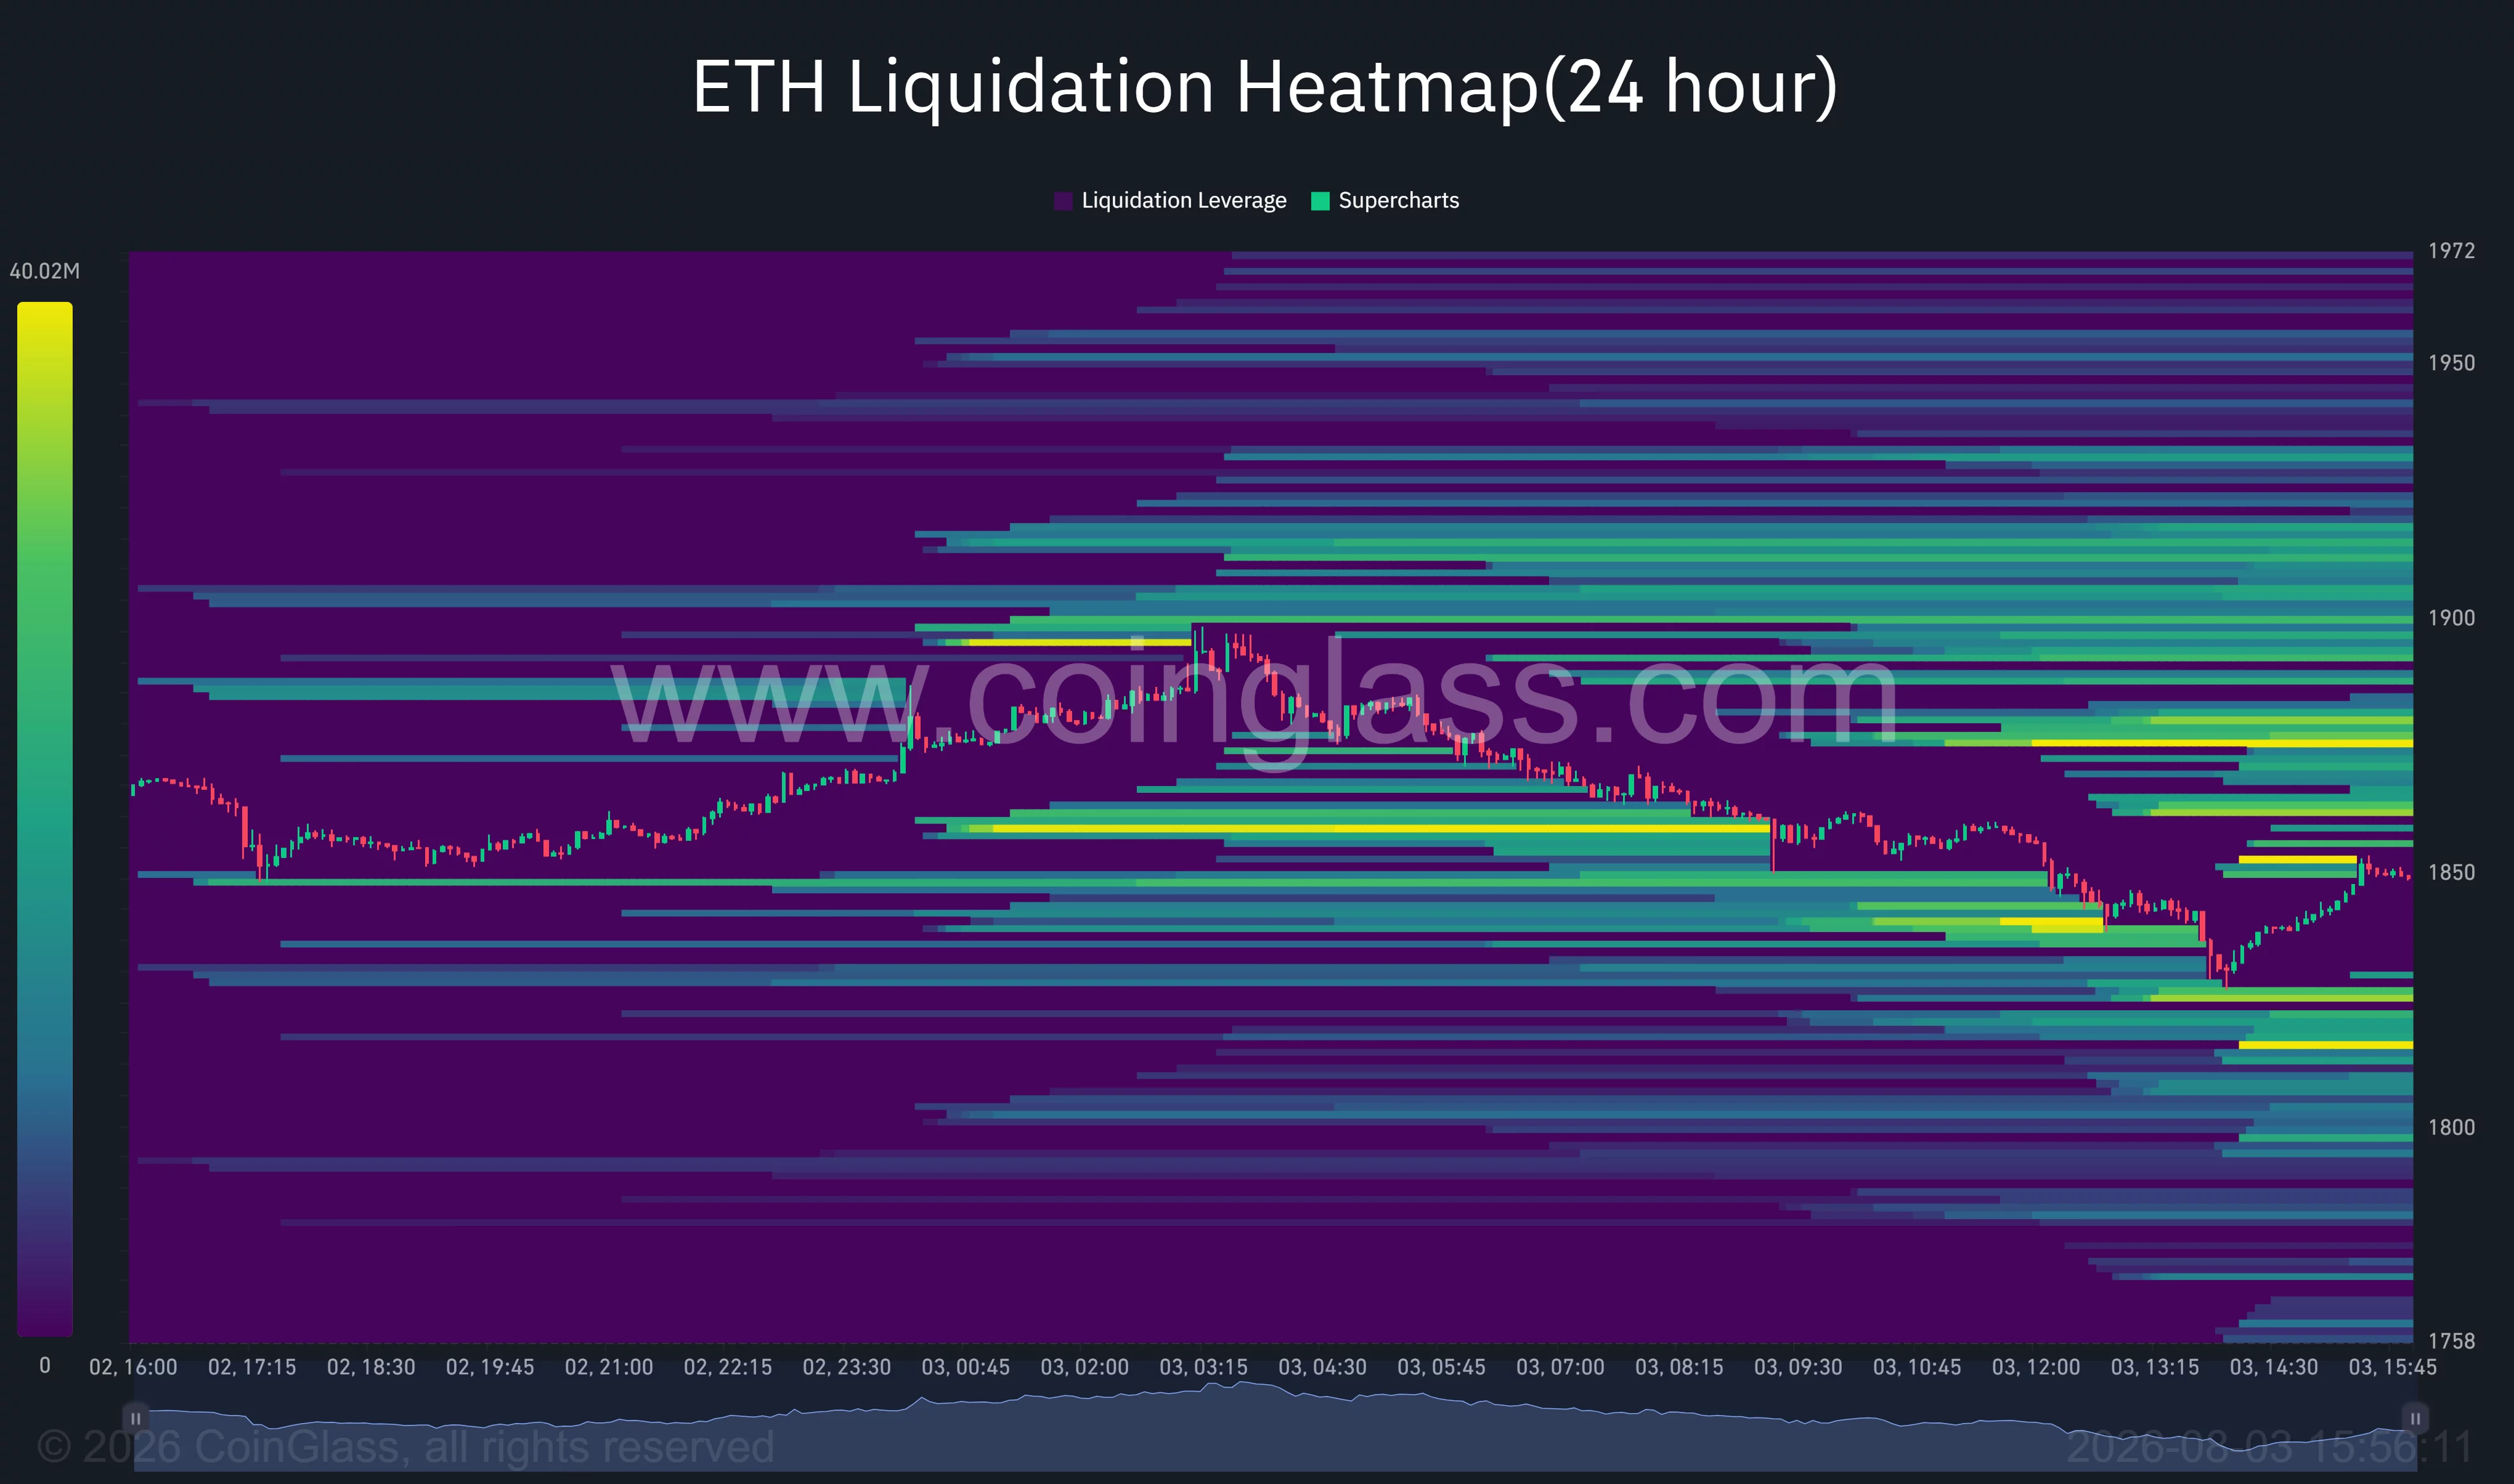
The map also shows overhead liquidity around $1,860–$1,875. If ETH rebounds above that range, short liquidations could help drive the price toward $1,890 and $1,920.
On the upside, Ethereum must first reclaim its 50-day SMA at $1,889. A daily close above the 100-day SMA at $1,927 would improve the setup, while a breakout above $1,975 would invalidate the current sequence of lower highs and place $2,000 back in focus.
The daily Relative Strength Index stands at 48.81, below its signal average of 56.44. The reading points to weakening momentum but remains well above oversold territory, leaving room for further selling if $1,800 fails.
Analyst sees Ethereum at a critical support zone
Crypto analyst Ted Pillows described the current support range as decisive for Ethereum’s next move.
“ETH is currently in the $1,800–$1,850 support level,” Pillows said. “This is very crucial for Ethereum to hold, or else it could drop towards $1,700.”
His chart presents two potential paths. Holding the current zone could allow ETH to recover toward $1,950 and then $2,050, while a confirmed breakdown could send the price toward $1,700.
The forecast aligns with the support levels visible on the daily chart, but the $1,700 target would require ETH to lose both the psychological $1,800 level and support near $1,785.
Fed outlook adds pressure on US crypto investors
Changing expectations for US monetary policy remain an additional risk for Ethereum and other speculative assets. Higher Treasury yields and a stronger dollar can reduce investor demand for crypto by increasing the relative appeal of dollar-denominated assets.
Slower-than-expected Federal Reserve rate cuts would keep financial conditions tighter and could limit institutional risk-taking. Ethereum may therefore remain sensitive to upcoming US inflation, employment and Fed policy signals.
For US investors, the near-term setup depends on whether ETH can defend $1,800 as macro liquidity remains constrained. A recovery above $1,927 would improve the technical outlook, but a daily close below $1,785 would shift attention toward $1,700.
Disclosure: This article does not represent investment advice. The content and materials featured on this page are for educational purposes only.
