


Ethereum price has fallen by over 35% since the beginning of this year. However, a bullish pattern forming on charts now suggests a potential bounce back to earlier levels if confirmed.
Summary
- Ethereum remains down over 35% year to date, trading near $2,172 amid macro pressure from geopolitical tensions, inflation risks, and a hawkish Fed outlook.
- A cup and handle pattern has formed on the daily chart, with a breakout above $2,400 potentially opening the path toward $3,000.
- Institutional sentiment shows early recovery signs with $302.8 million in ETF inflows this month, though momentum indicators still reflect weak bullish strength.
According to data from crypto.news, Ethereum (ETH) price was trading at $2,172 at press time, down 8% from its weekly high and 35.7% from its year-to-date high of $3,379.
Ethereum price fell in tandem with Bitcoin (BTC) and the wider crypto market as the macro environment for risk-on assets continued to deteriorate across the globe.
Some of the headwinds that have weighed investor sentiment down include U.S. tariff threats against the EU and Canada, the successive escalation of war between the U.S. and Iran in the Middle East, and a hawkish stance from the Federal Reserve on interest rate cuts for this year.
Investors have also been rotating to traditional safe-haven assets such as Gold and other precious metals as they seek protection against geopolitical instability and inflationary pressures.
Outflows from spot Ethereum ETFs over the past two months also left the market vulnerable to sudden price swings. These institutional vehicles have, however, shown a resurgence this month, drawing in $302.8 million in total net inflows so far, a sign that institutions are betting on a recovery at these discounted levels.
On the daily chart, Ethereum price has been forming a large cup and handle pattern since early February this year. The pattern is formed with a rounded bottom representing a period of stabilization and a slight downward handle indicating a final shakeout of weak hands.
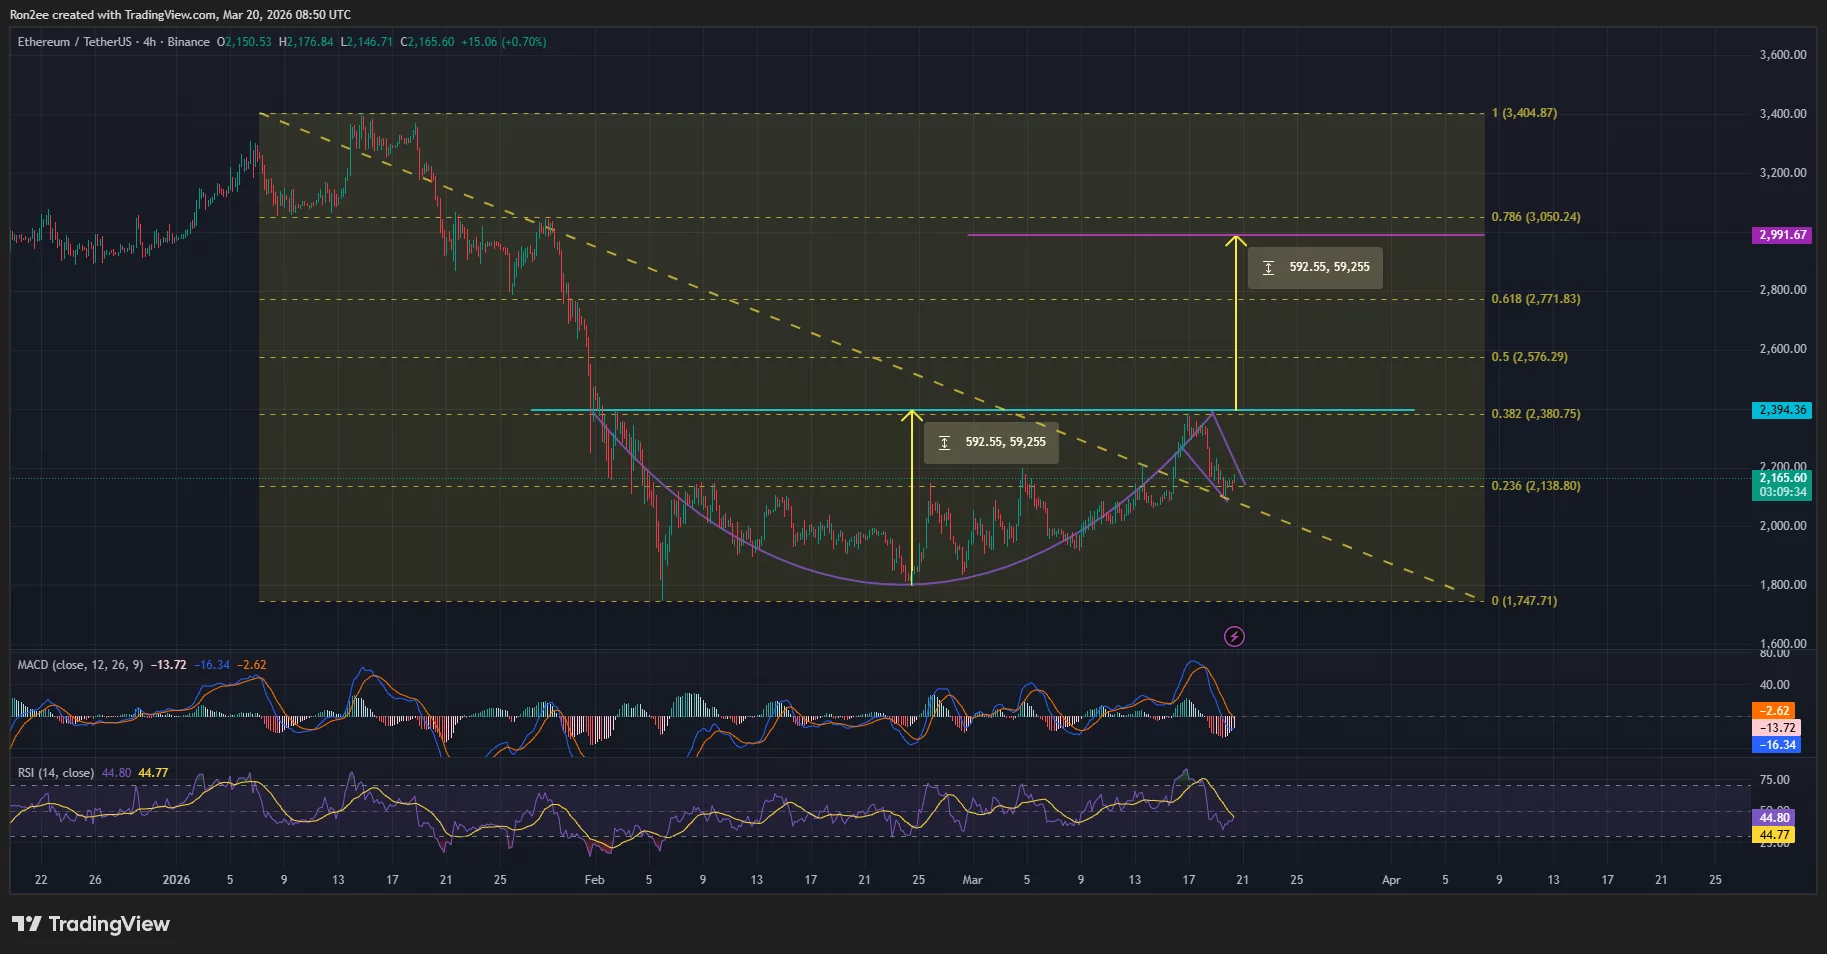
The neckline of the pattern lies at the $2,400 psychological resistance level. A decisive breakout here could push Ethereum up all the way to $3,000, a level calculated by adding the height of the cup formed to the point at which the pattern would be confirmed.
Momentum indicators seem to suggest that bears were still dominating the market at press time. The MACD lines were pointed downwards while the Relative Strength Index was at 40.85, slightly under the neutral thresholds but beginning to flatten as selling pressure exhausts.
For now, the key resistance to watch is the $2,400 psychological barrier, which it failed to break during the market-wide bounce on Tuesday. On the lower side, $2,000 remains a critical support zone that must hold to prevent a slide back toward the yearly lows.
Disclosure: This article does not represent investment advice. The content and materials featured on this page are for educational purposes only.