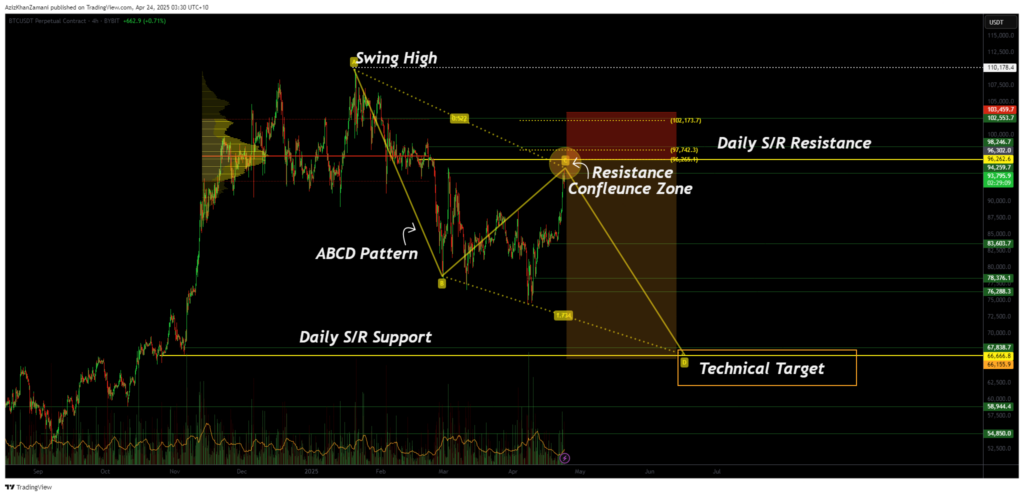
Bitcoin is now at a pivotal turning point, trading into a dense cluster of technical resistance. While momentum has favored bulls recently, confluence with several high time frame metrics suggests this may be the setup for a deeper corrective phase.
Bitcoin (BTC) is currently trading at a significant resistance region, where multiple high time frame technicals converge. These include the previous point of control, the value area low of a prior range, and most notably, the 0.618 Fibonacci level, which aligns with the potential completion of a C-leg in an ABCD correction pattern.
This setup gains further relevance as the price structure forms a classic ABC retracement against the prevailing uptrend, hinting at the potential for a deeper leg lower if resistance holds.
Key points
- Bitcoin is testing resistance at the .618 Fibonacci extension, aligned with major high timeframe levels.
- The price structure resembles an ABCD corrective pattern with C-leg completion at current levels.
- Short squeeze behavior has driven the rally, lacking organic support—raising rejection probability.

The ABCD corrective pattern, widely recognized in Elliott Wave Theory, is unfolding clearly on Bitcoin’s chart. This structure is characterized by three waves: the A-wave pulls back from local highs, the B-wave continues the trend, and the C-wave retraces again before the D-leg potentially drives a deeper move.
Currently, Bitcoin appears to be completing its C-leg, and the area around $94,000–$95,000 is presenting major technical resistance. This includes confluence from the 0.618 Fibonacci retracement from the all-time high and key high time frame daily support/resistance levels.
The recent rally appears to have been driven primarily by short covering rather than healthy spot accumulation. This lack of organic buying is a concern for bulls, especially when price meets a dense resistance cluster.
Volume remains inconsistent, and the market’s reaction at this level will likely determine Bitcoin’s next major swing direction. If rejection occurs at the current C-leg zone, it may trigger the D-leg pullback and complete the correction.
Momentum traders and structure-based analysts are closely watching the $60,000–$67,000 zone, as it lines up with the projected D-leg of this ABCD pattern. This region also offers a high probability location for a macro higher low, aligning with the broader trend and possibly forming the base for the next impulsive wave.
What to expect in the coming price action
If current resistance holds and a rejection plays out, Bitcoin is likely to rotate lower toward the $60K–$67K region. This would complete the ABCD correction and establish a key higher low within the broader trend.
However, if price reclaims the $94,000–$95,000 resistance zone with strong volume and follow-through, it could invalidate the bearish setup and open the door for continuation toward all-time highs.
For now, caution is warranted as Bitcoin tests a major technical ceiling.


