Close Menu

    Subscribe to Updates

    Get the latest creative news from FooBar about art, design and business.

    What's Hot

    Whales dominate Plasma launch

    July 1, 2025

    Dow Jones up 300 points as Senate passes Trump’s budget, Tesla drops 8%

    July 1, 2025

    Bitcoin price goes nowhere as corporates pass BTC around

    July 1, 2025
    Facebook X (Twitter) Instagram
    Tuesday, July 1
    • About
    • Contact us
    • Privacy Policy
    Facebook X (Twitter) LinkedIn YouTube
    Blockchain Echo
    Banner
    • Lithosphere News Releases
    • Bitcoin
    • Crypto
    • Ethereum
    • Litecoin
    • Altcoins
    • Blockchain
    Blockchain Echo
    Home » Weekly price analysis: crypto prices reel from risk off sentiments
    Ethereum

    Weekly price analysis: crypto prices reel from risk off sentiments

    Sophia BrownBy Sophia BrownFebruary 18, 2025No Comments3 Mins Read
    Facebook Twitter Pinterest LinkedIn Tumblr Email
    Share
    Facebook Twitter LinkedIn Pinterest Email


    • The crypto market trended lower last week as US tariffs rocked the market, causing investors to flee to safe-haven assets like Gold
    • Crypto prices, which recovered slightly on Monday and Tuesday, continued trending downward as uncertainty looms
    • Meanwhile, spot ETF inflows remained positive despite some days of outflows

    Bitcoin

    Bitcoin’s price trended lower over the last week following US President Donald Trump’s announcement of tariffs on Canada, Mexico, and China. Investors fled to safe-haven assets like gold while risky assets, like crypto, trended lower.

    However, the tariffs are a catalyst for faster price declines as price action shows that Bitcoin was already on a decline in its substructure after failing to swing higher than the $108,000 level three weeks ago.

    BTC/USD chart by TradingView

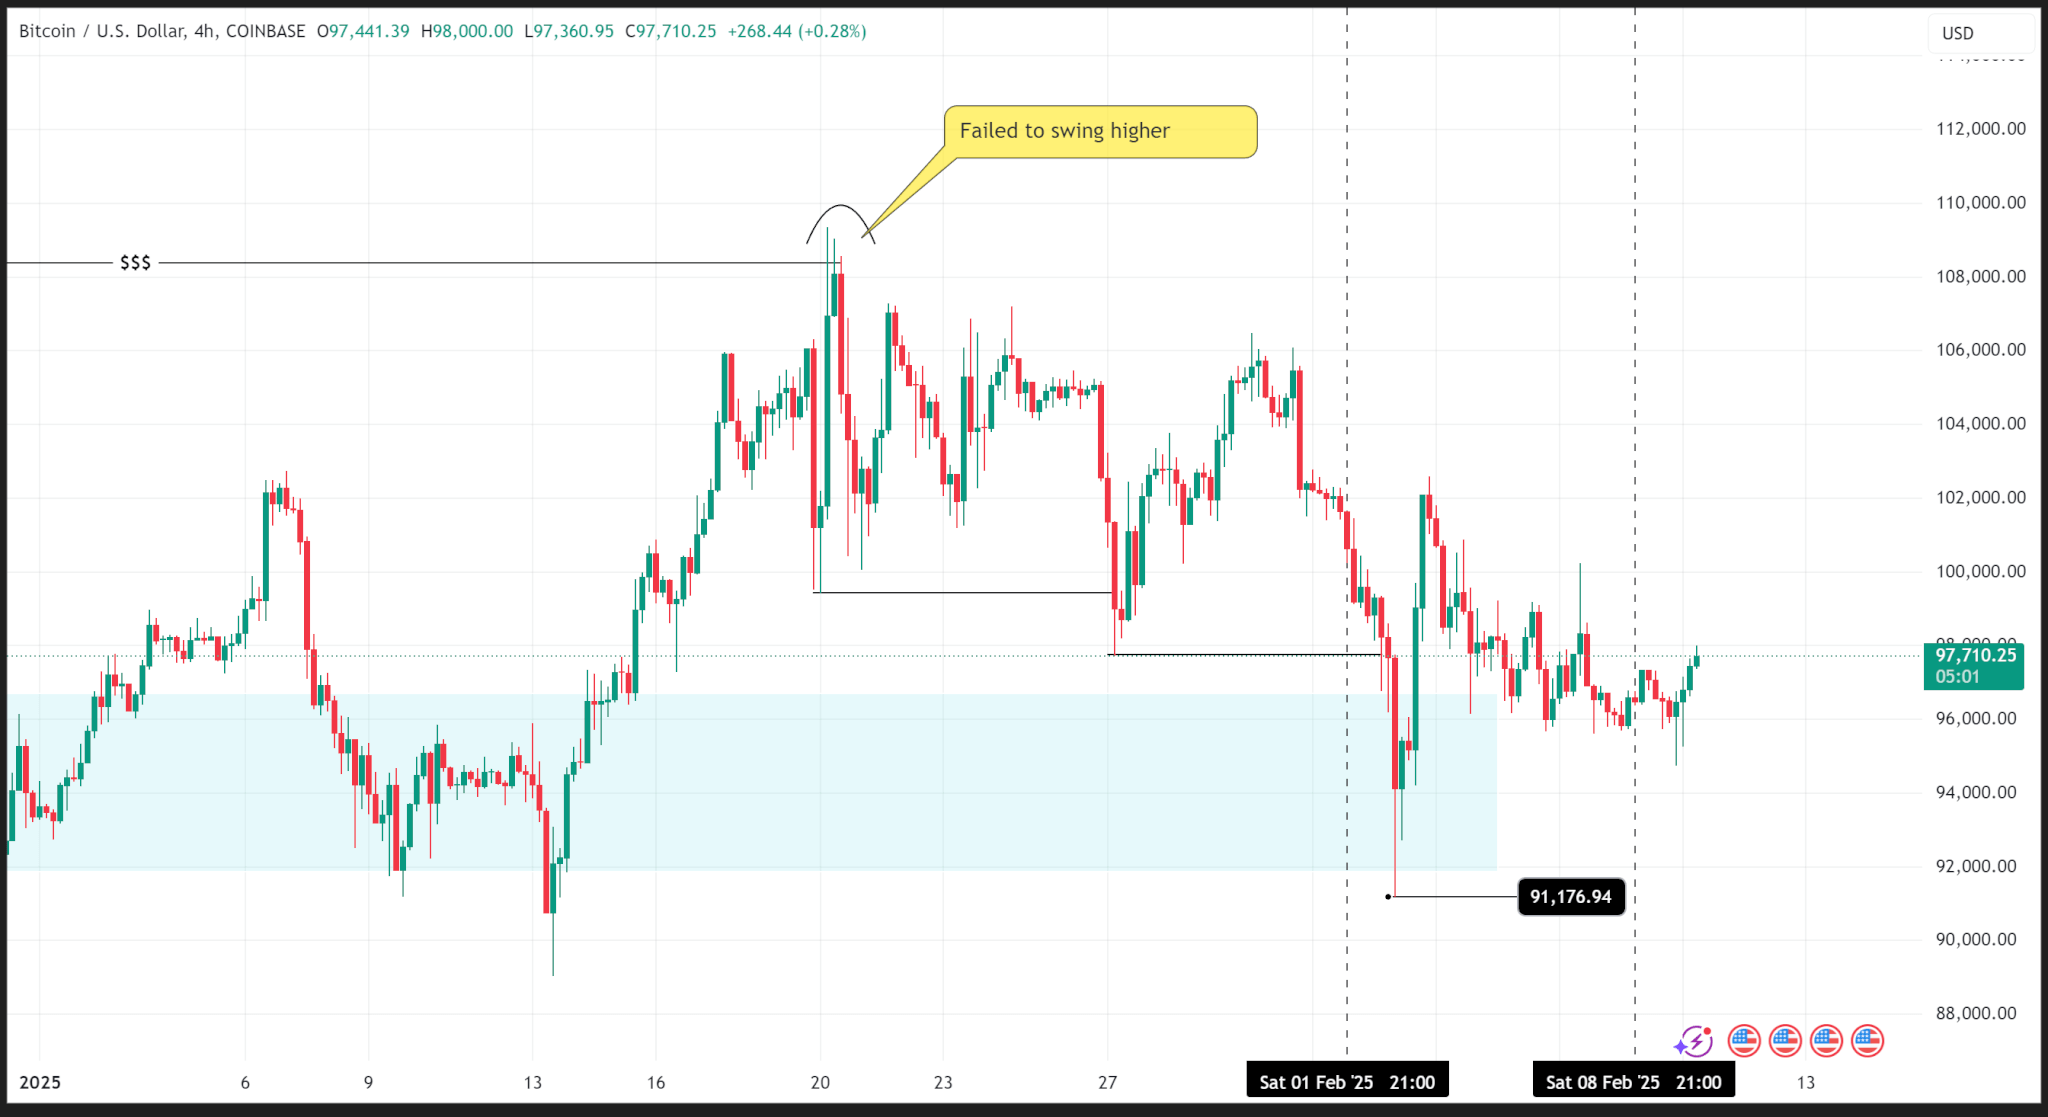
    BTC made two consecutive lower lows on the substructure over the last two weeks and traded into the daily demand zone early last week, logging a weekly low of $91,176.94.

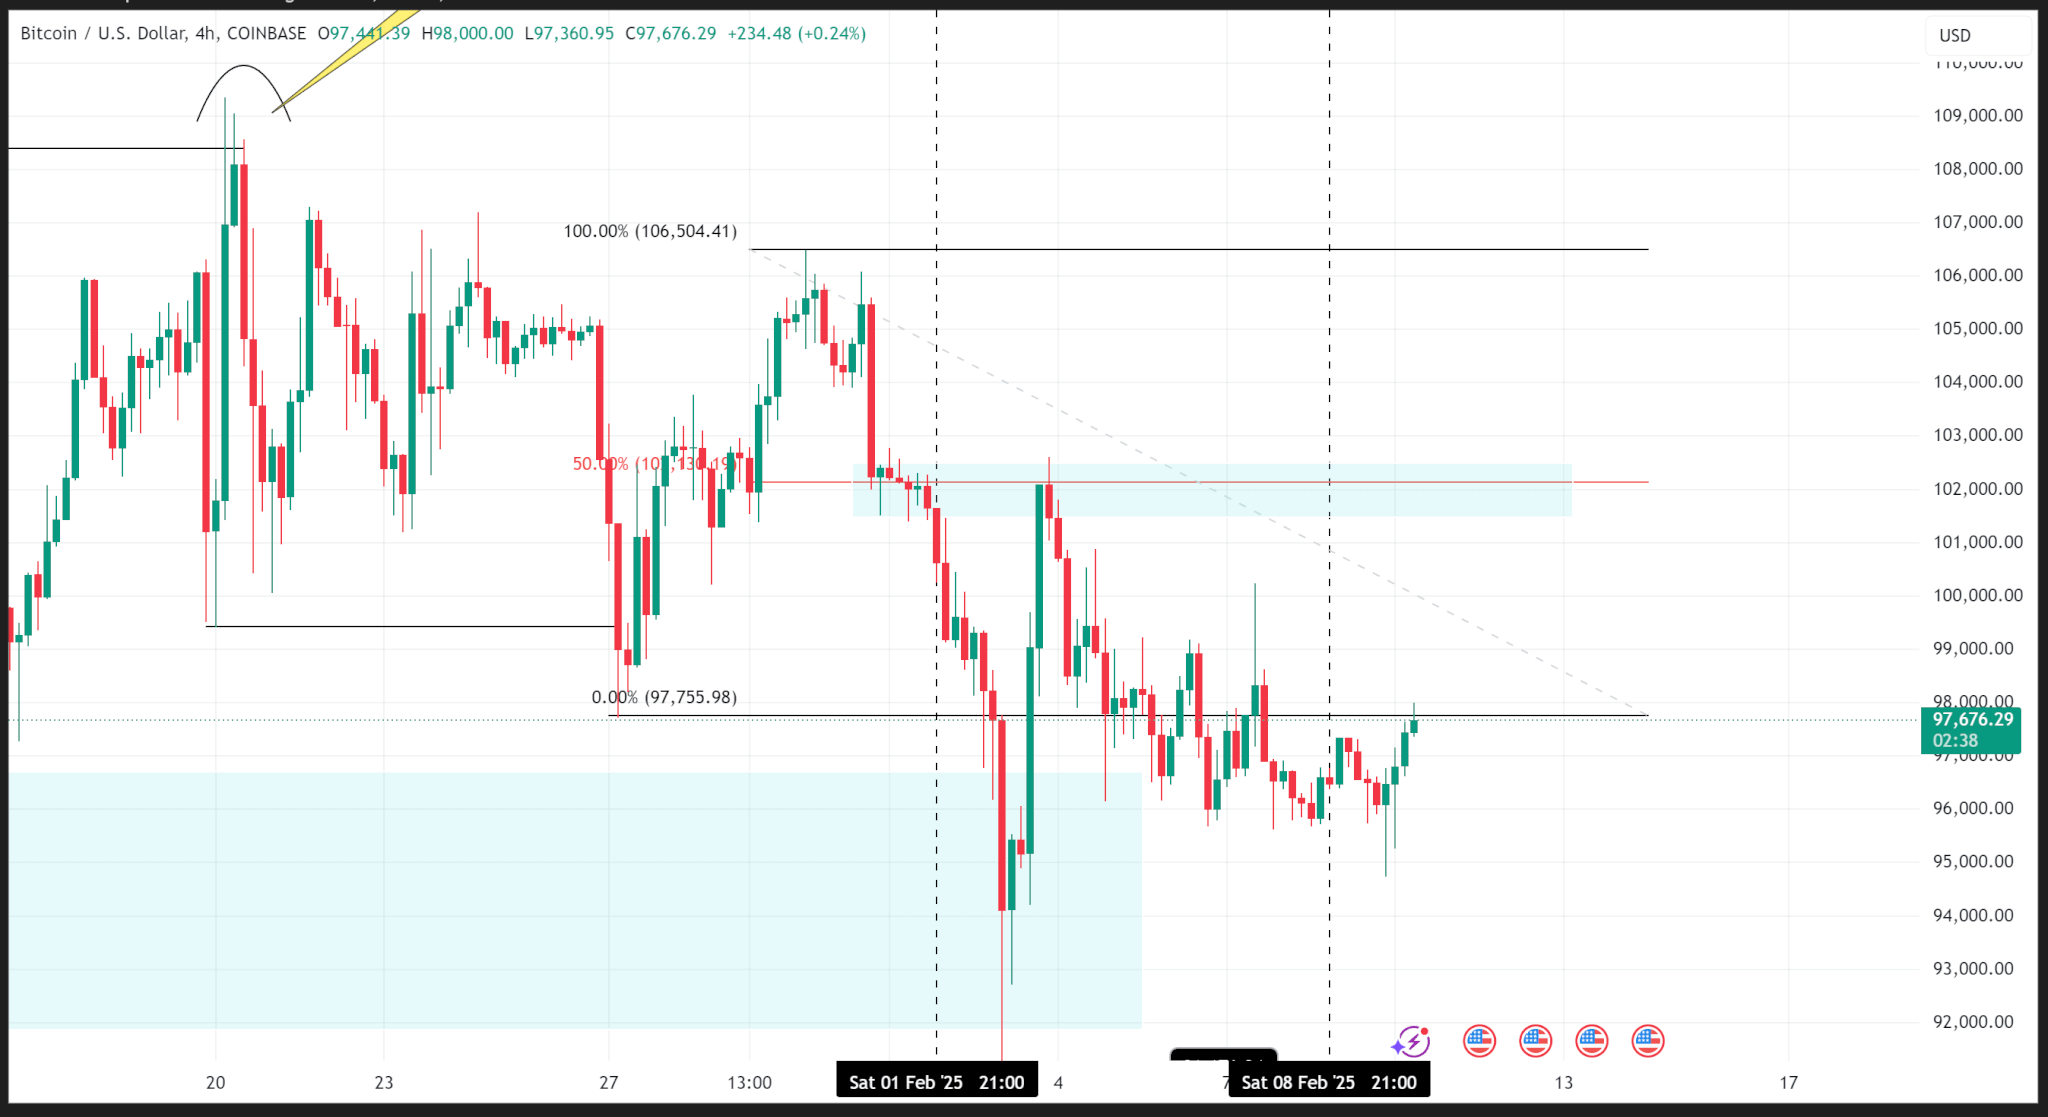
    After buying from the demand zone, the price rose to an internal supply zone at $102,000, validated by the 50% Fibonacci level, and sold off that zone to end the week at $96,475.03.

    BTC/USD chart by TradingView

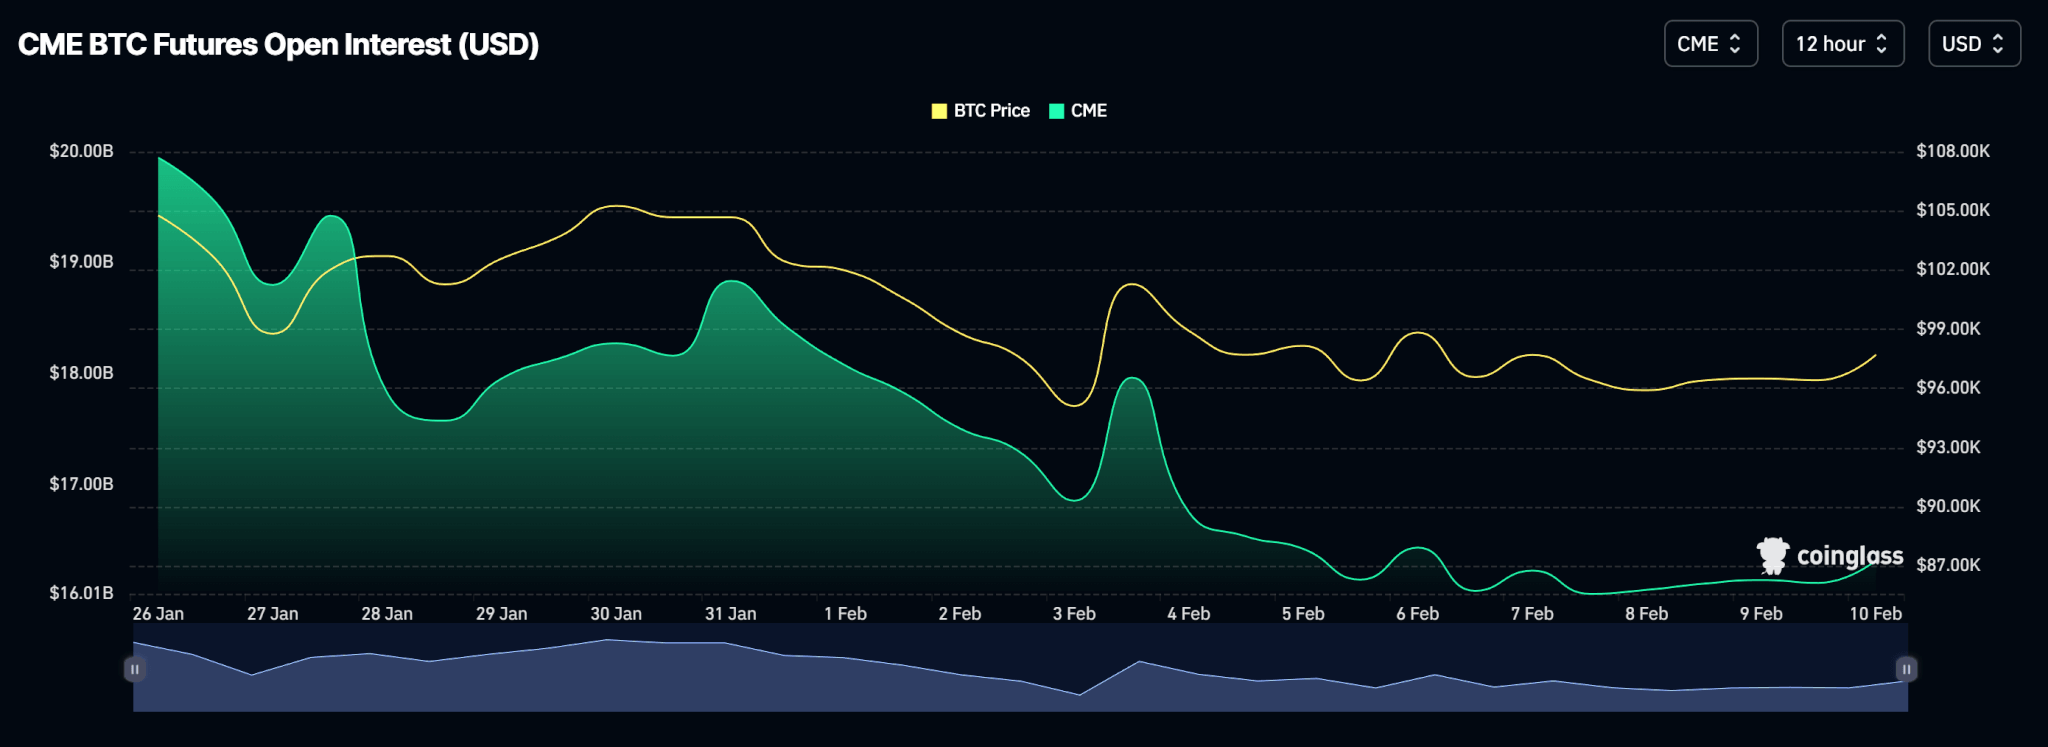
    On the CME, where Bitcoin Futures are traded the most, open interest fell last week as traders closed contracts due to uncertainty caused by Trump’s tariffs.

    BTC/USD chart by Coinglass

    Meanwhile, spot BTC ETFs logged a positive week as net flows printed $208.30 million despite two days of major outflows.

    Price Outlook

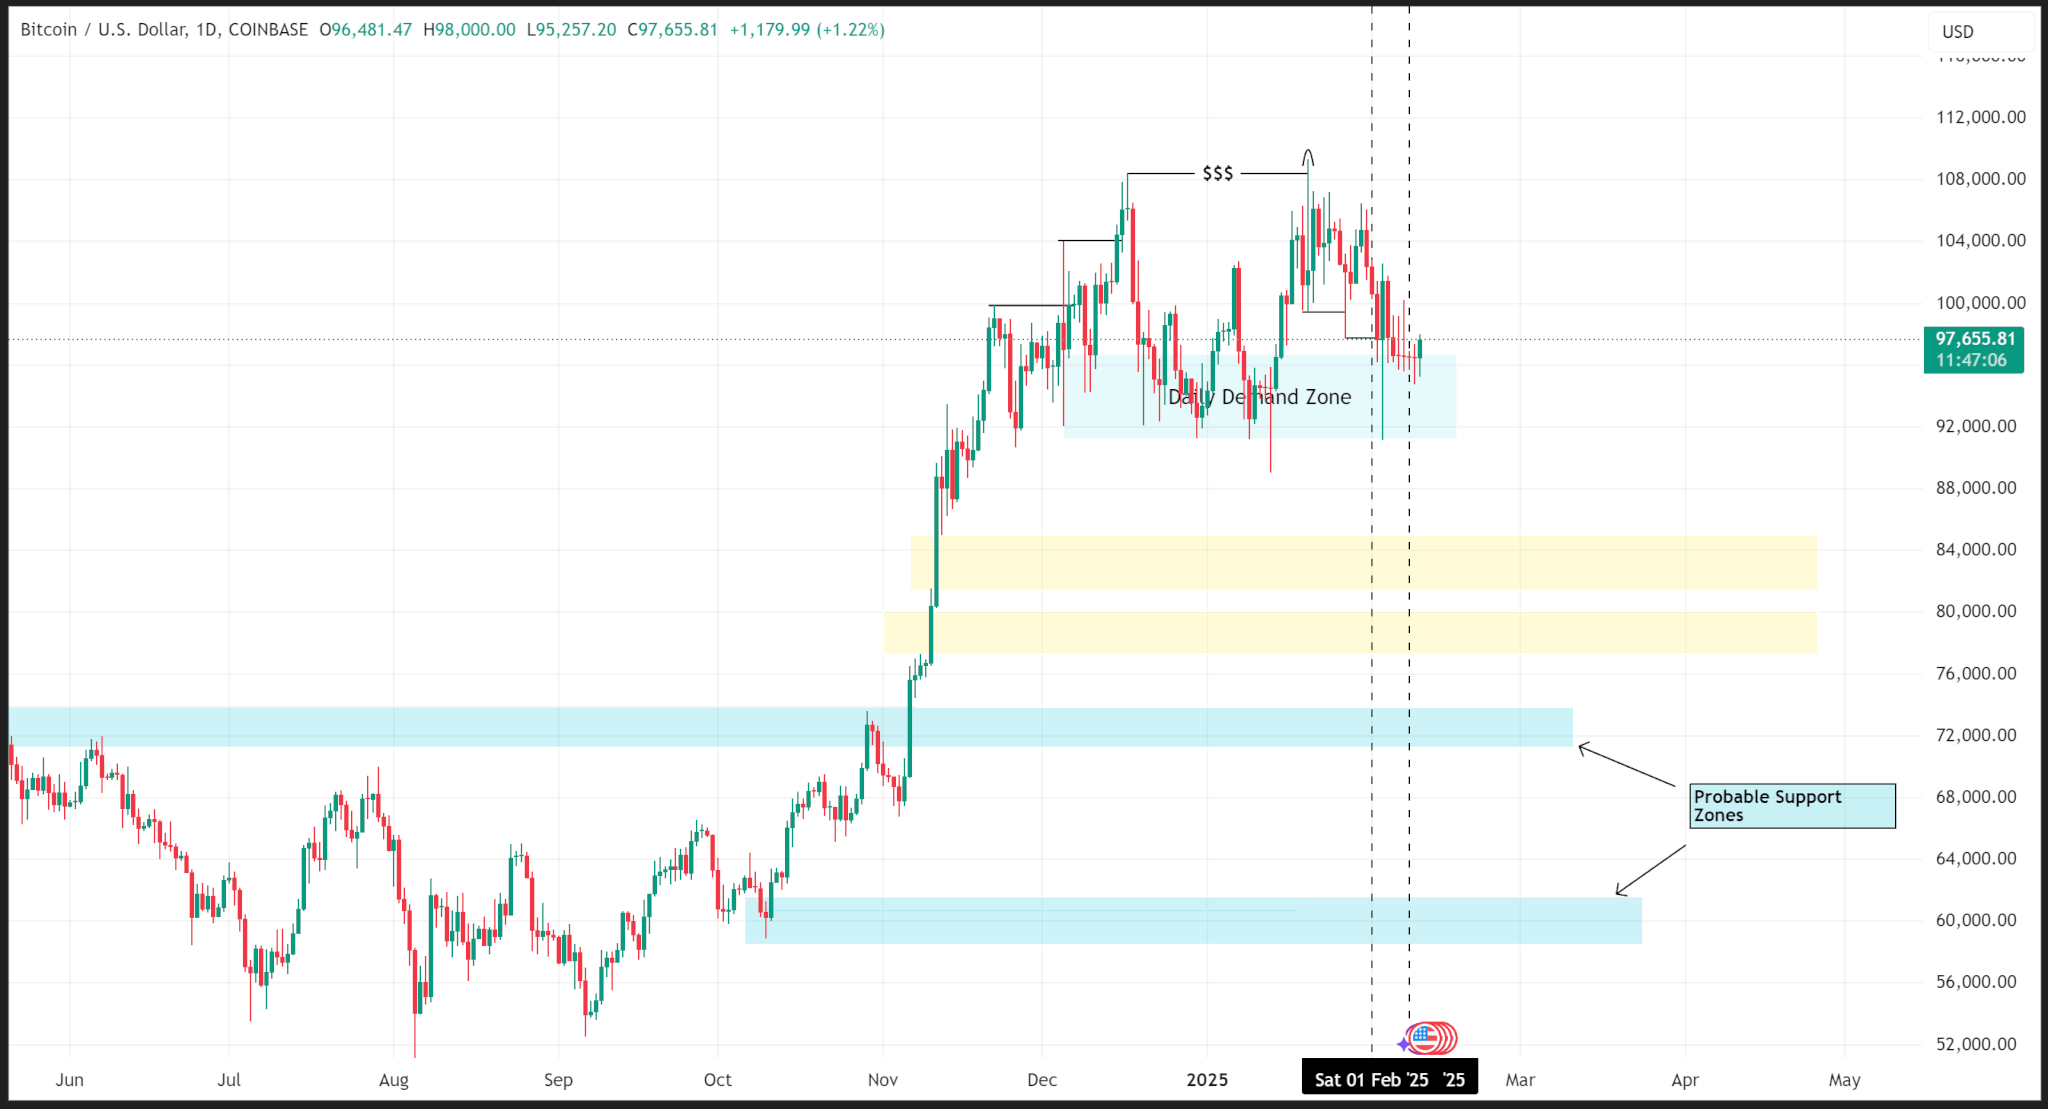
    Provided the price remains above the demand zone on the daily timeframe, then Bitcoin’s overall structure should remain bullish despite price declines on the substructure.

    However, a daily close below the demand zone, i.e., below the $90,000 level, may trigger a sell-off to support levels around $84,000 or lower.

    BTC/USD chart by TradingView

    BTC trades at $97,624.73 as of publishing.

    Ethereum

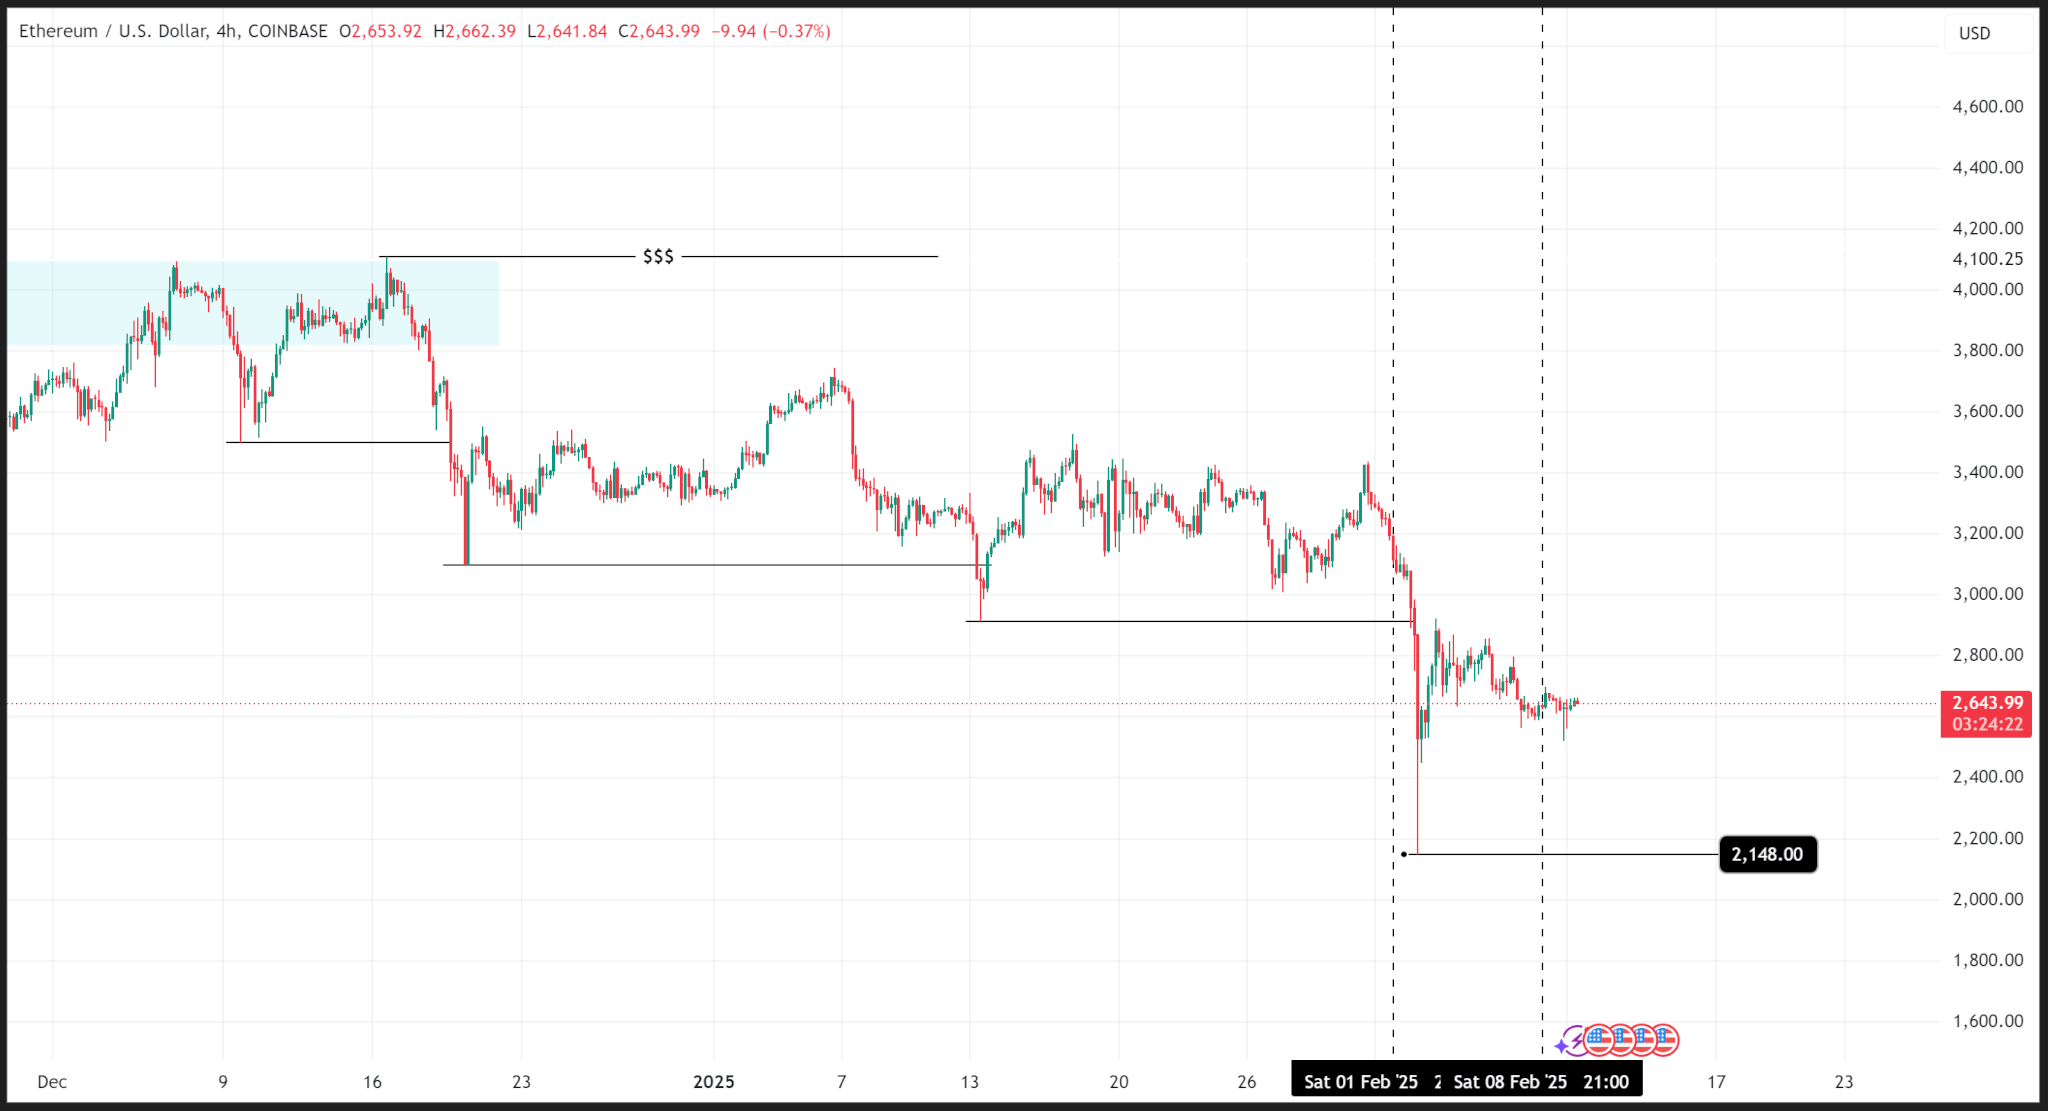
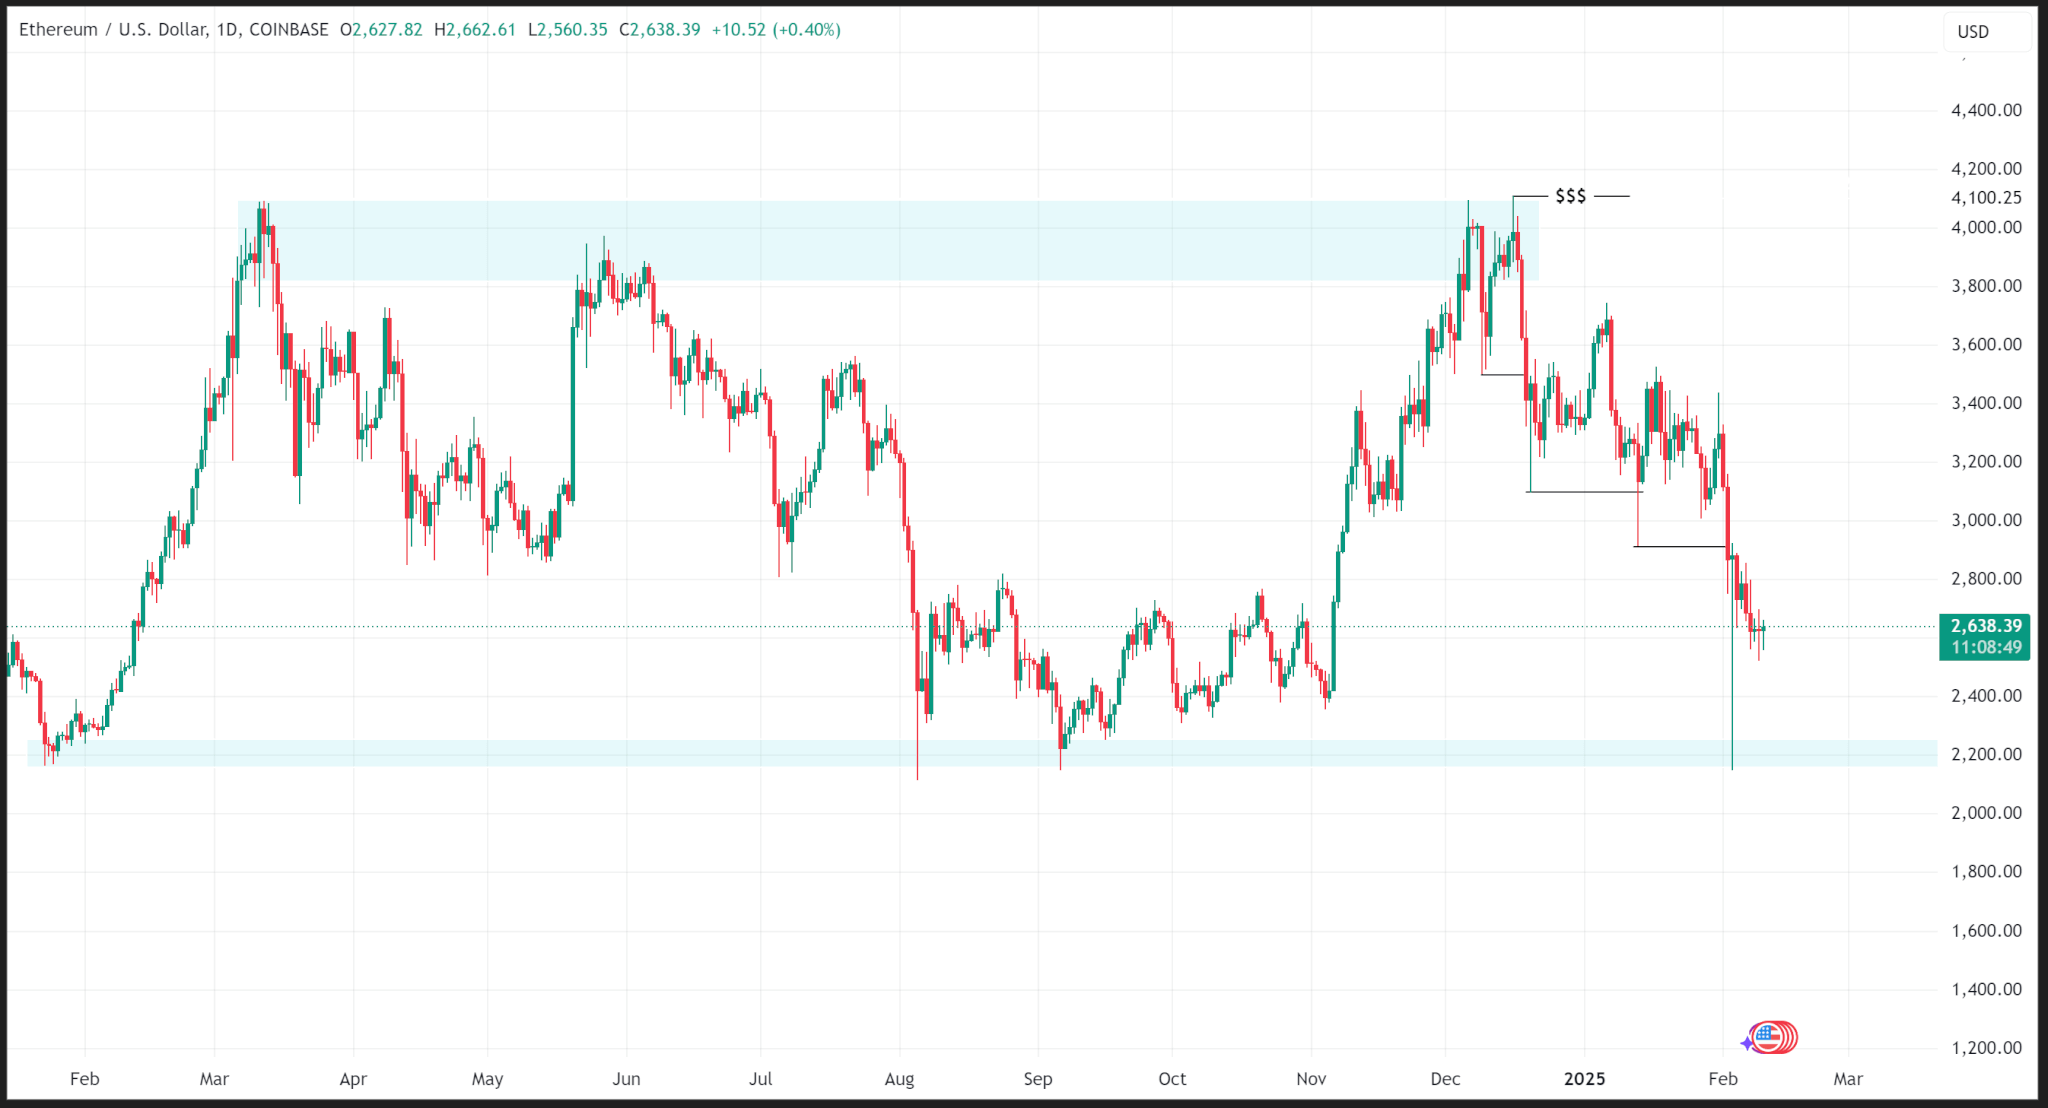
    After failing to break above March 2024 highs, Ethereum’s price has been on a downtrend on its substructure since mid-December 2024.

    ETH/USD chart by TradingView

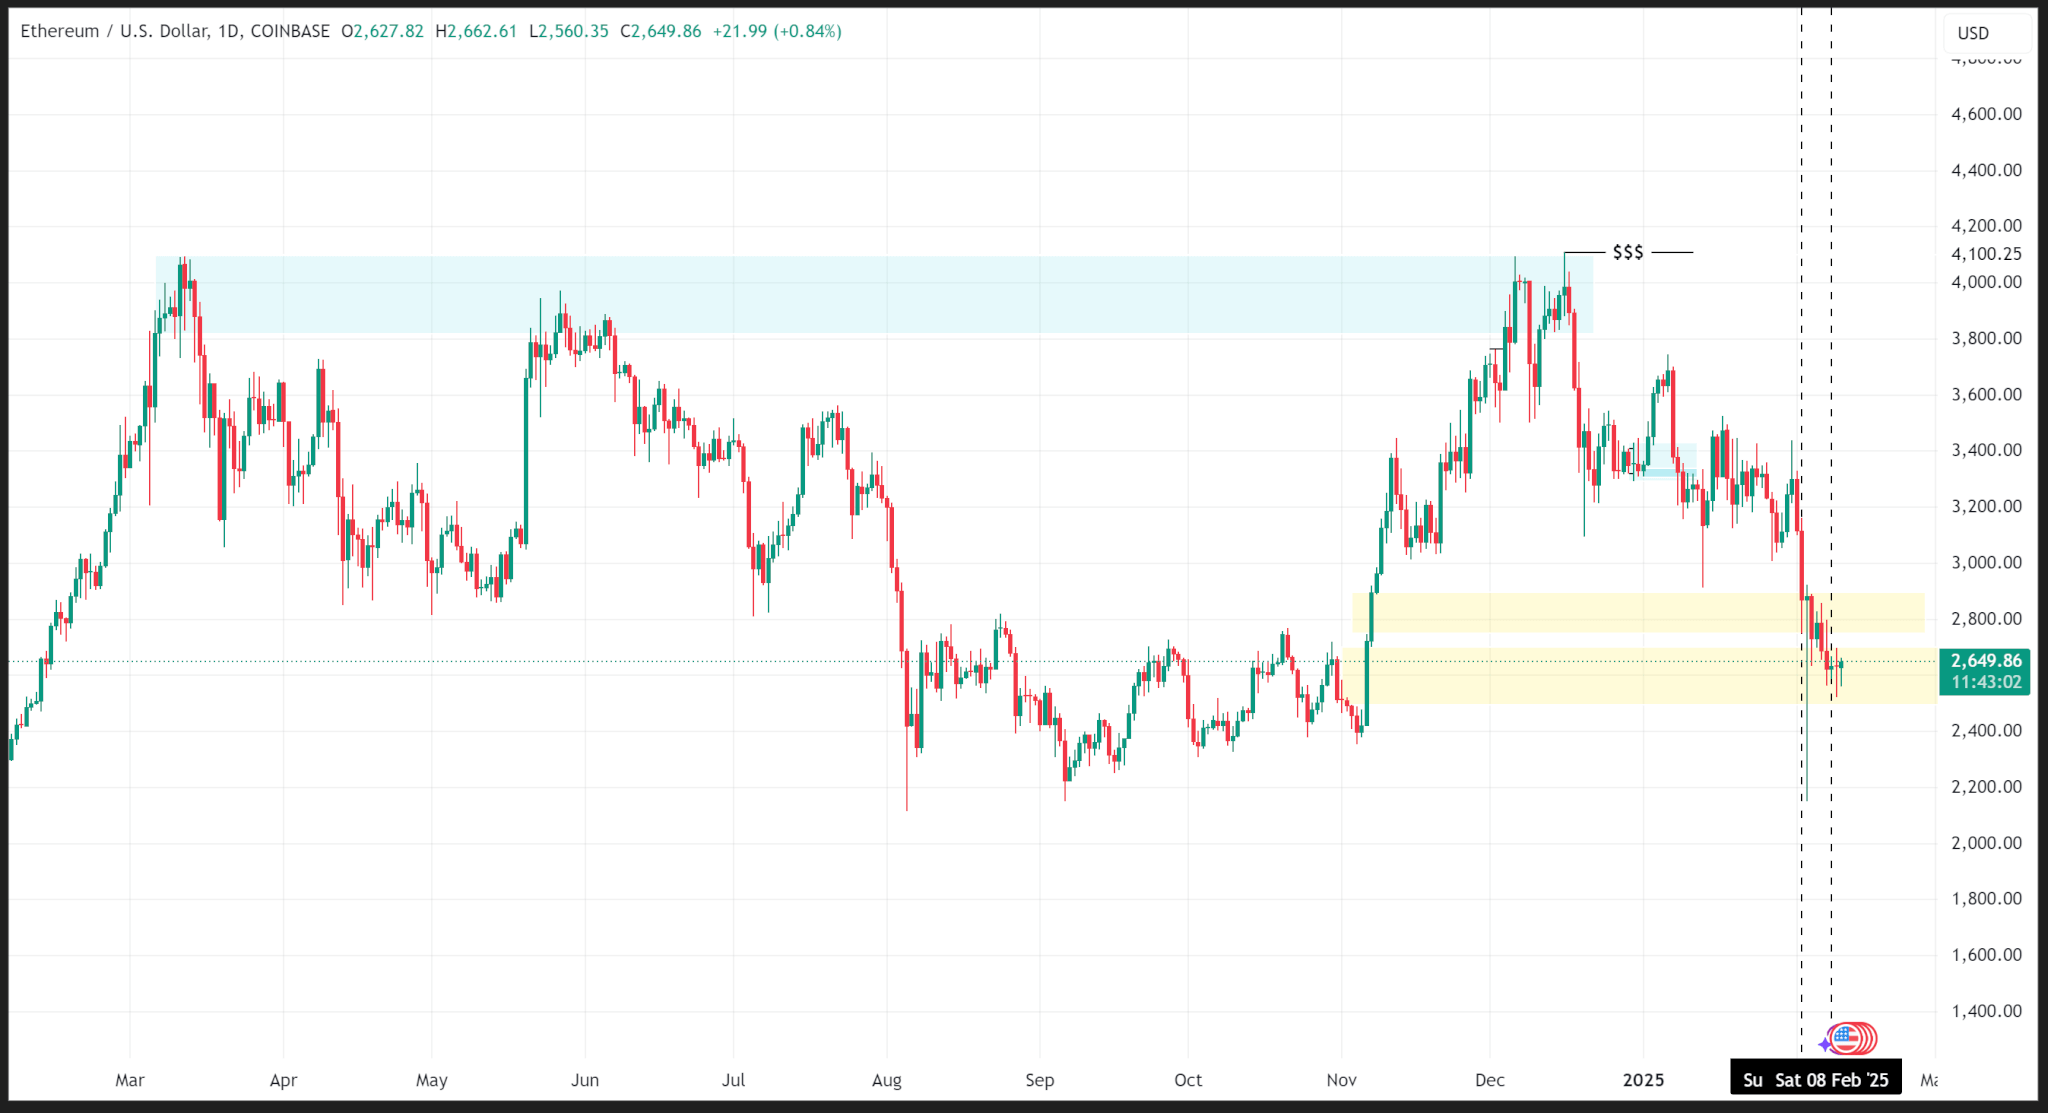
    On the 4-hour timeframe, the price logged consecutive lower lows with the most recent low of $2,148.00 reached early last week. The price has improved since then, closing last week at $2,632.16.

    ETH/USD chart by TradingView

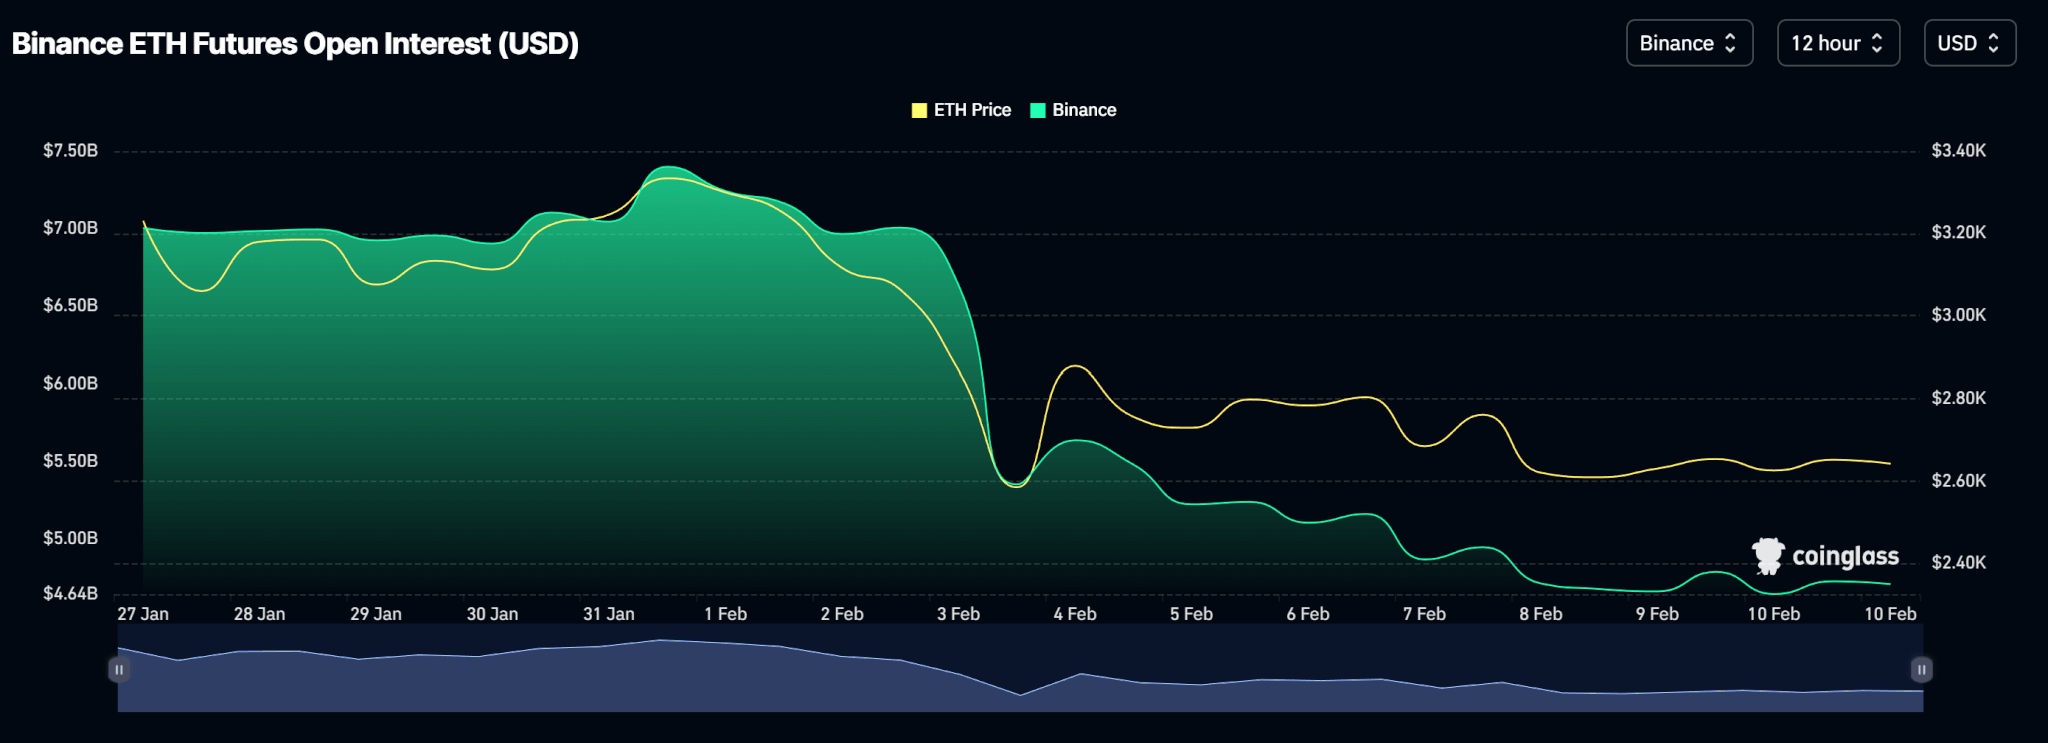
    Open interest on Binance, where Ethereum Futures are traded the most, shows a decline in the number of open contracts, which could be another catalyst for price declines.

    ETH/USD chart by Coinglass

    Meanwhile, spot ETH ETFs logged positive inflows  last week, aside from Friday when it logged no inflows (or outflows), totalling $420.20 million for the week.

    Price Outlook

    The next probable zone for ETH’s price to fall is a major support zone around $2,200. With Trump planning to impose a 25% tariff on steel and aluminium as well as a fresh round of retaliatory tariffs against trade partners, more uncertainty could push ETH’s price there soon.

    ETH/USD chart by TradingView

    ETH trades at $2,640.05 as of publishing.


    Share this article

    Categories

    Tags


    Source link

    Share. Facebook Twitter Pinterest LinkedIn Tumblr Email
    Previous ArticleInvestor interest in a new token grows as it moves beyond initial expectations
    Next Article Cyprus police warn of large-scale SMS crypto scam impersonating Binance: report
    Sophia Brown

    Related Posts

    Katana mainnet launch nears as pre-deposit closes with $200M in active deposits

    June 30, 2025

    World Experience: Updates from the Next Billion Fellowship

    June 28, 2025

    World Experience: Updates from the Next Billion Fellowship

    June 28, 2025
    Leave A Reply Cancel Reply

    Top Posts

    🐍 Lunar New Year Scratch & Win Campaign Is Live with a Grand Prize of 8,888,888 VERSE (~$1800) | by Bitcoin.com | Jan, 2025

    January 24, 2025

    Trade VERSE/USDT on KuCoin to Earn your Share of $8400 in Rewards! | by Bitcoin.com | Jan, 2025

    January 24, 2025

    Boost Your Crypto: Up to 30% Cash Back! | by Bitcoin.com | Jan, 2025

    January 24, 2025
    Stay In Touch
    • Facebook
    • YouTube
    • TikTok
    • WhatsApp
    • Twitter
    • Instagram
    Latest Reviews

    Subscribe to Updates

    Get the latest tech news from FooBar about tech, design and biz.

    About Us

    Stay updated on the world of cryptocurrency
    Your one-stop source for daily crypto news and insights
    Blockchainecho.info: Your trusted daily crypto companion

    Most Popular

    🐍 Lunar New Year Scratch & Win Campaign Is Live with a Grand Prize of 8,888,888 VERSE (~$1800) | by Bitcoin.com | Jan, 2025

    January 24, 2025

    Trade VERSE/USDT on KuCoin to Earn your Share of $8400 in Rewards! | by Bitcoin.com | Jan, 2025

    January 24, 2025

    Boost Your Crypto: Up to 30% Cash Back! | by Bitcoin.com | Jan, 2025

    January 24, 2025
    Copyright © 2025
    • Home
    • Buy Now

    Type above and press Enter to search. Press Esc to cancel.